Using Collections to Perform Quality Control Analysis of Cohort Data
This blog post introduces the concept of collections: a user-defined collection of projects that allows projects and samples to be organised and analysed at the cohort level. We will briefly look at how we can collect projects together and perform quality control (QC) of sample data. These QC tasks are typically more usefully performed at the cohort level where larger sample numbers provide a better background for comparison.
We will use the 1,000G Extended Demo collection for this example. We are using this collection to represent the type of data organisation we see in rare disease or NICU sequencing projects. Each patient case (typically a family trio of patient/proband and their parents) has a project in Mosaic to store all information and analyses on the patient. All patient cases are then organised in a collection where high level statistics can be collected, QC tasks can be performed etc. with all results shared with the team.
Organising projects
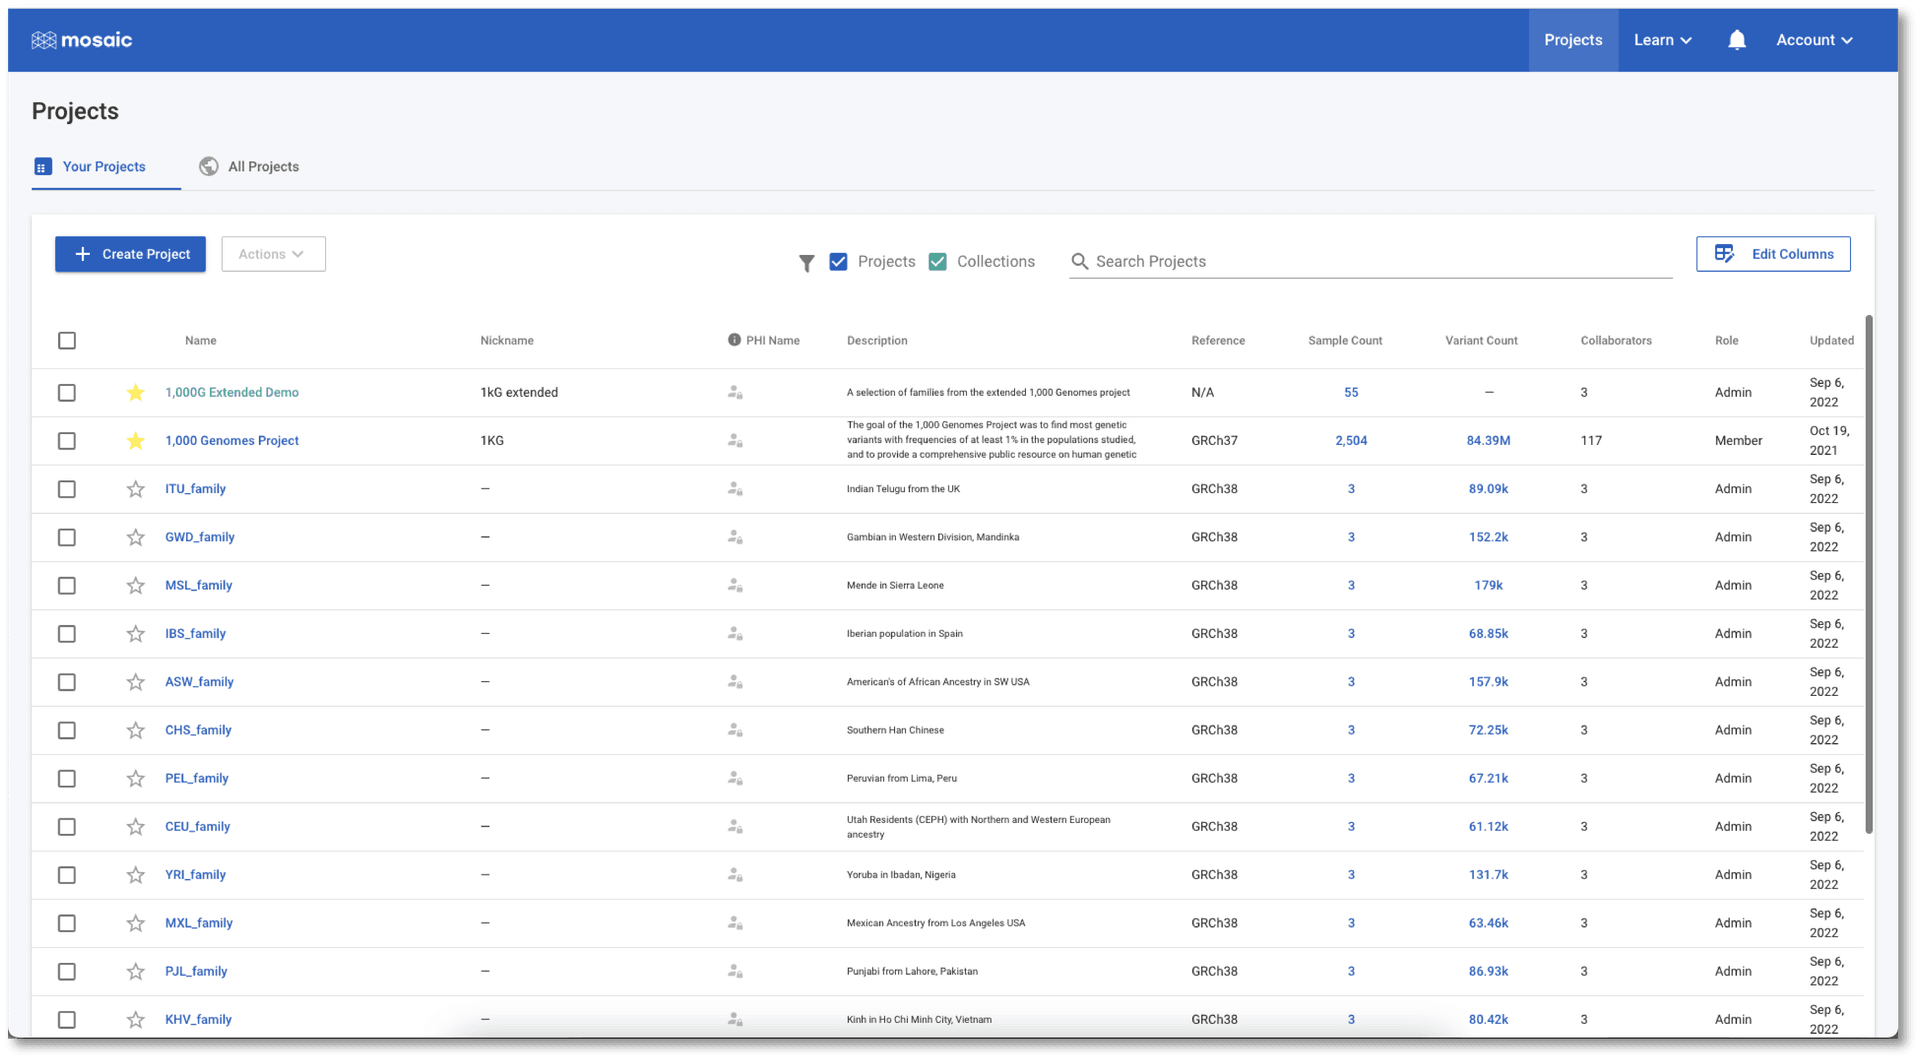
On Mosaic's main page, collections are highlighted in green to distinguish them from projects. A button indicating the number of projects in a collection appears when hovering over a collection row. This button can be very useful as clicking it takes us immediately to the table of all projects in the collection. Clicking anywhere else on the row takes us to the collection home.
For information on adding or removing projects from a collection, see this tutorial.
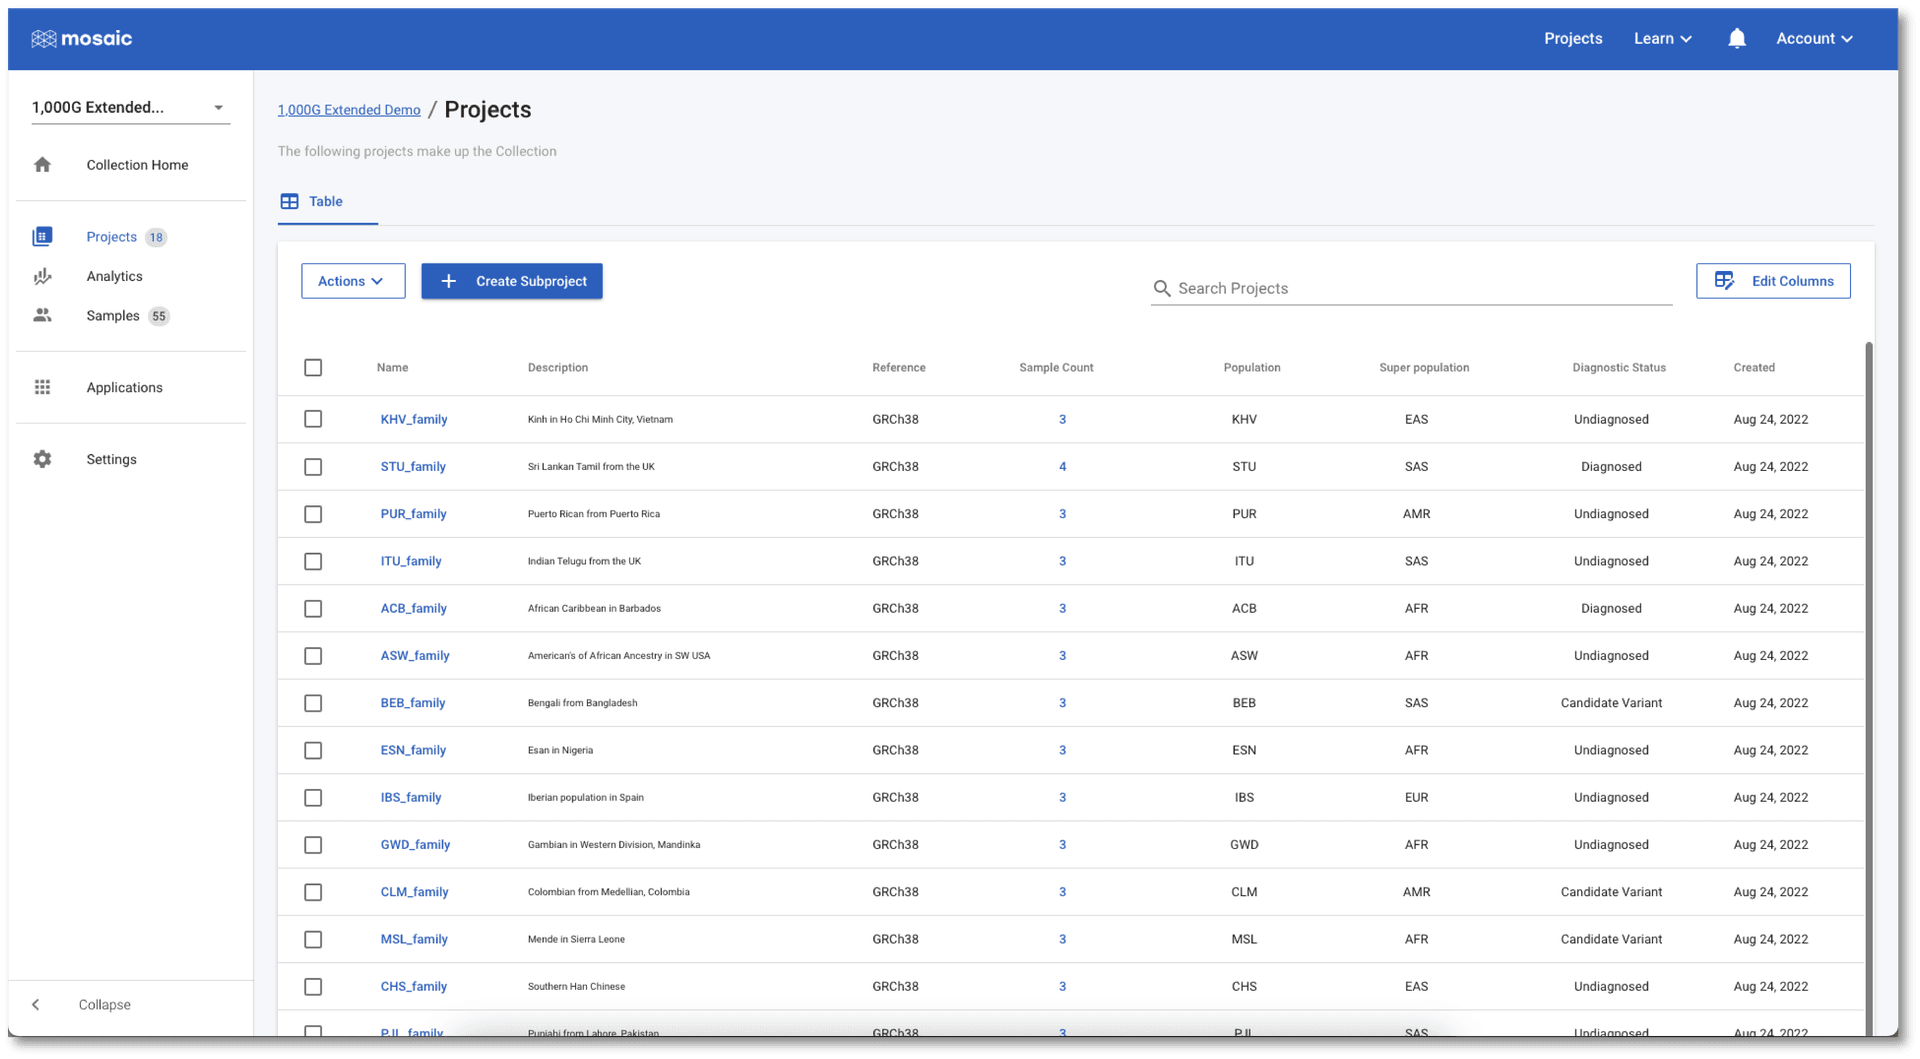
If we jump to the Projects view in the 1,000G Extended Demo collection (either from the button mentioned above, or by clicking Projects in the left menu once in the collection), we see a list of all the projects. This table contains information on project attributes: i.e. attributes containing information at the project level (as opposed to, for example, the sample level). The table can be sorted on any of the displayed attributes and provides a quick and easy way to quickly find, or compare projects in the collection. For people managing these projects, this table is an efficient place to update these attributes from a single place, by hovering over any value in the table and clicking the edit icon that appears. We can customise this, and any table in Mosaic, to show only the attributes we want to see (see this tutorial for more details). This means that every user can tailor their views in Mosaic to be exactly what they need.
Visualization of project and sample level analytics
The table view is perfect for finding projects with specific details, editing values, and navigating to projects, but charts are always better for gaining an understanding of the data. Collections have two levels of charting available. Click on Analytics in the left menu and you will be taken to the Project Charts page. Here we can use the Select Charts button above the charting area to select any of the project level attributes to view. In the screenshot below, I have chosen to view a horizontal bar chart showing which super populations the family trios come from. I have also included a pie chart of the diagnostic status of each trio. This is a dummy variable (none of these 1,000 Genomes Projects are diagnostic cases) representing the type of project level information typically collected in clinical research cases.
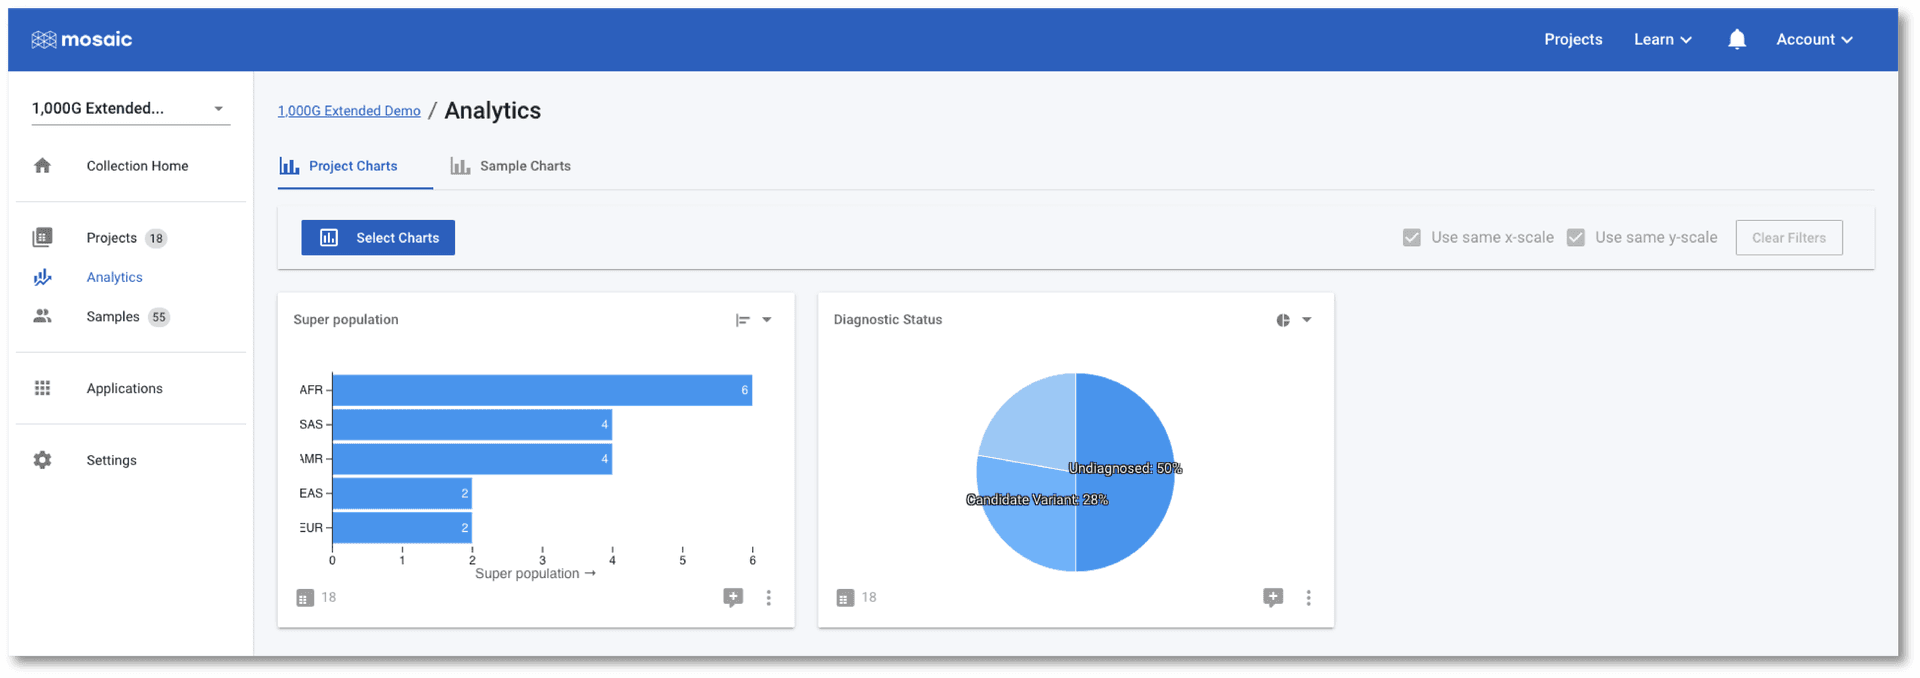
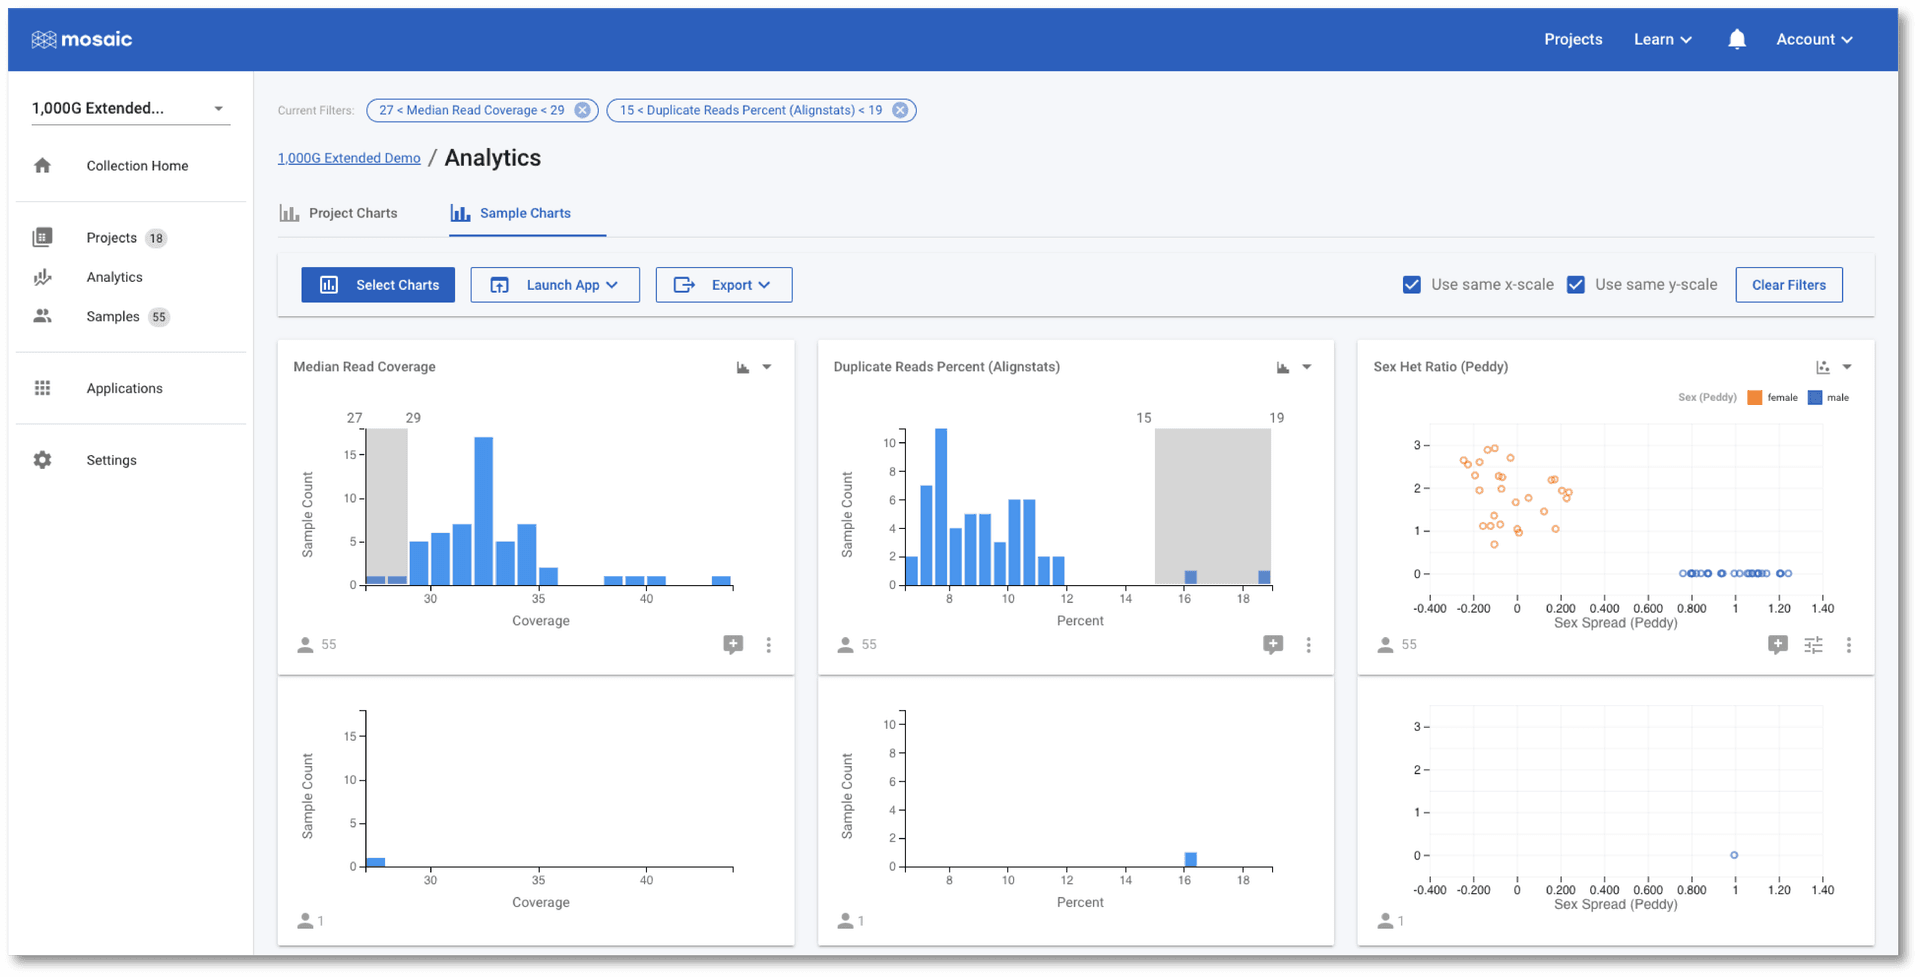
The tab at the top of the page allows us to switch between Project Charts and Sample Charts. As the name implies, the Sample Charts tab allows us to view charts of data for all of the samples in all the projects in the collection. This is an ideal place to perform QC tasks on cohorts of data.
As with the Project Charts, you can use the Select Charts button to choose to plot any of the sample attributes. This post gives an introduction on building charts, so we will concentrate on using the charts to check if any of the samples in this demo project are outliers to the others based on some QC metrics. In the screenshot below I have chosen to view Median Read Coverage (which is typically calculated by default in Mosaic), Duplicate Reads Percent and Sex Het Ratio (QC metric from the Alignstats and Peddy tools respectively that have been integrated into Mosaic). The Sex Het Ratio shows the ratio of heterozygous to homozygous alternate calls on non-PAR regions of the X-chromosome on the y-axis. Samples are defined as being 0 - Female, or 1 - Male and each sample is placed randomly around this value on the x-axis. Male samples (with only one copy of the X-chromosome) are expected to have a ratio of approximately zero as they should not have any heterozygous calls. A quick glance at this chart should convince us that all samples appear to have the expected sex.
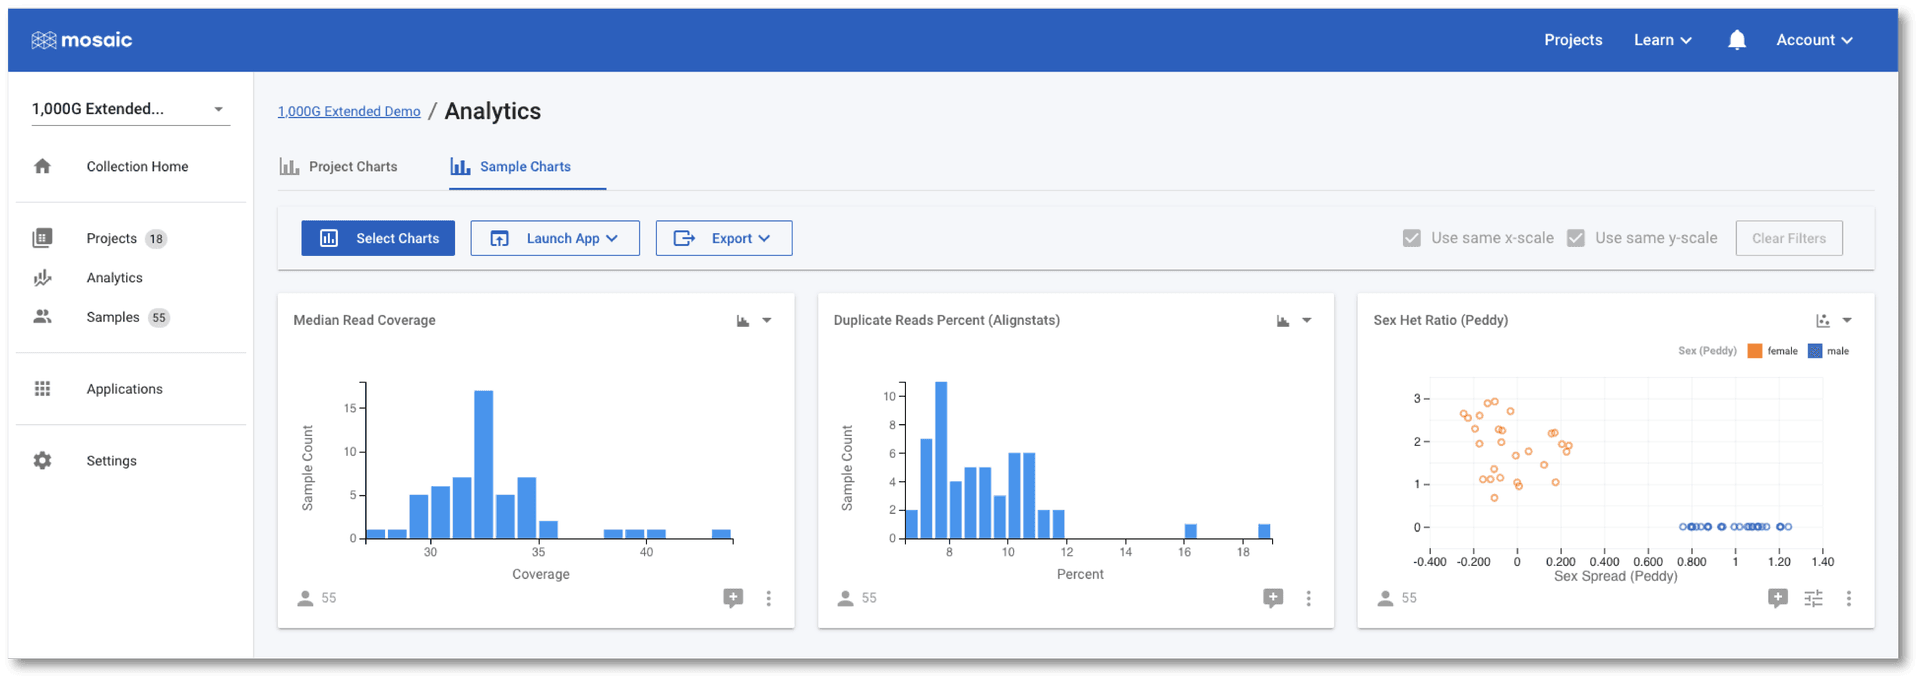
The Duplicate Reads Percent chart has a couple of samples at the far right of it's distribution, however. We can interact with these charts to identify these two outlier samples.
Once selected, one of these two outlier samples also appears to have a low Median Read Coverage as compared with the other samples. In the above screenshot, I have further filtered on the Median Read Coverage chart to identify the sample that is simultaneously high for one QC attribute and low for another. It is at this stage that we might wish to discuss this sample with our colleagues. We have a number of options we can now pursue:
- We can click the "comment plus" icon below a chart to open a conversation and start a discussion with colleagues about this observation of outlier samples,
- We can click on Samples in the left menu to see the list of samples passing the filters we have applied. In this case, the table will contain the single sample that simultaneously passes the filters applied in the screenshot above,
- We could start a conversation in the collection home and notify colleagues of our observation and determine if any action needs to be taken,
- We can click on the Export button above the charts to export the identified sample.
Conclusion
Collections are an effective way of organising projects into larger cohorts and performing meaningful analyses of the combined data. The various views and communication features mean that they can be used to perform administrative management of projects, quickly summarise the contained data, as well as allow for rapid QC analysis of all samples by all members of the team.