Advanced Analytics & Charts
Charts can be customized from the fullscreen view. Here users can make minor changes to improve formatting and clarity, and also make extensive customizations (e.g. combining multiple attributes) to create a wholly different chart that looks to answer different questions.
For this tutorial we will be looking at a collection and the project attribute, Social Deprivation index (SDI), which is a composite measure of area level deprivation based on seven demographic characteristics collected in the American Community Survey and used to quantify the socio-economic variation in health outcomes.
Change X Axis
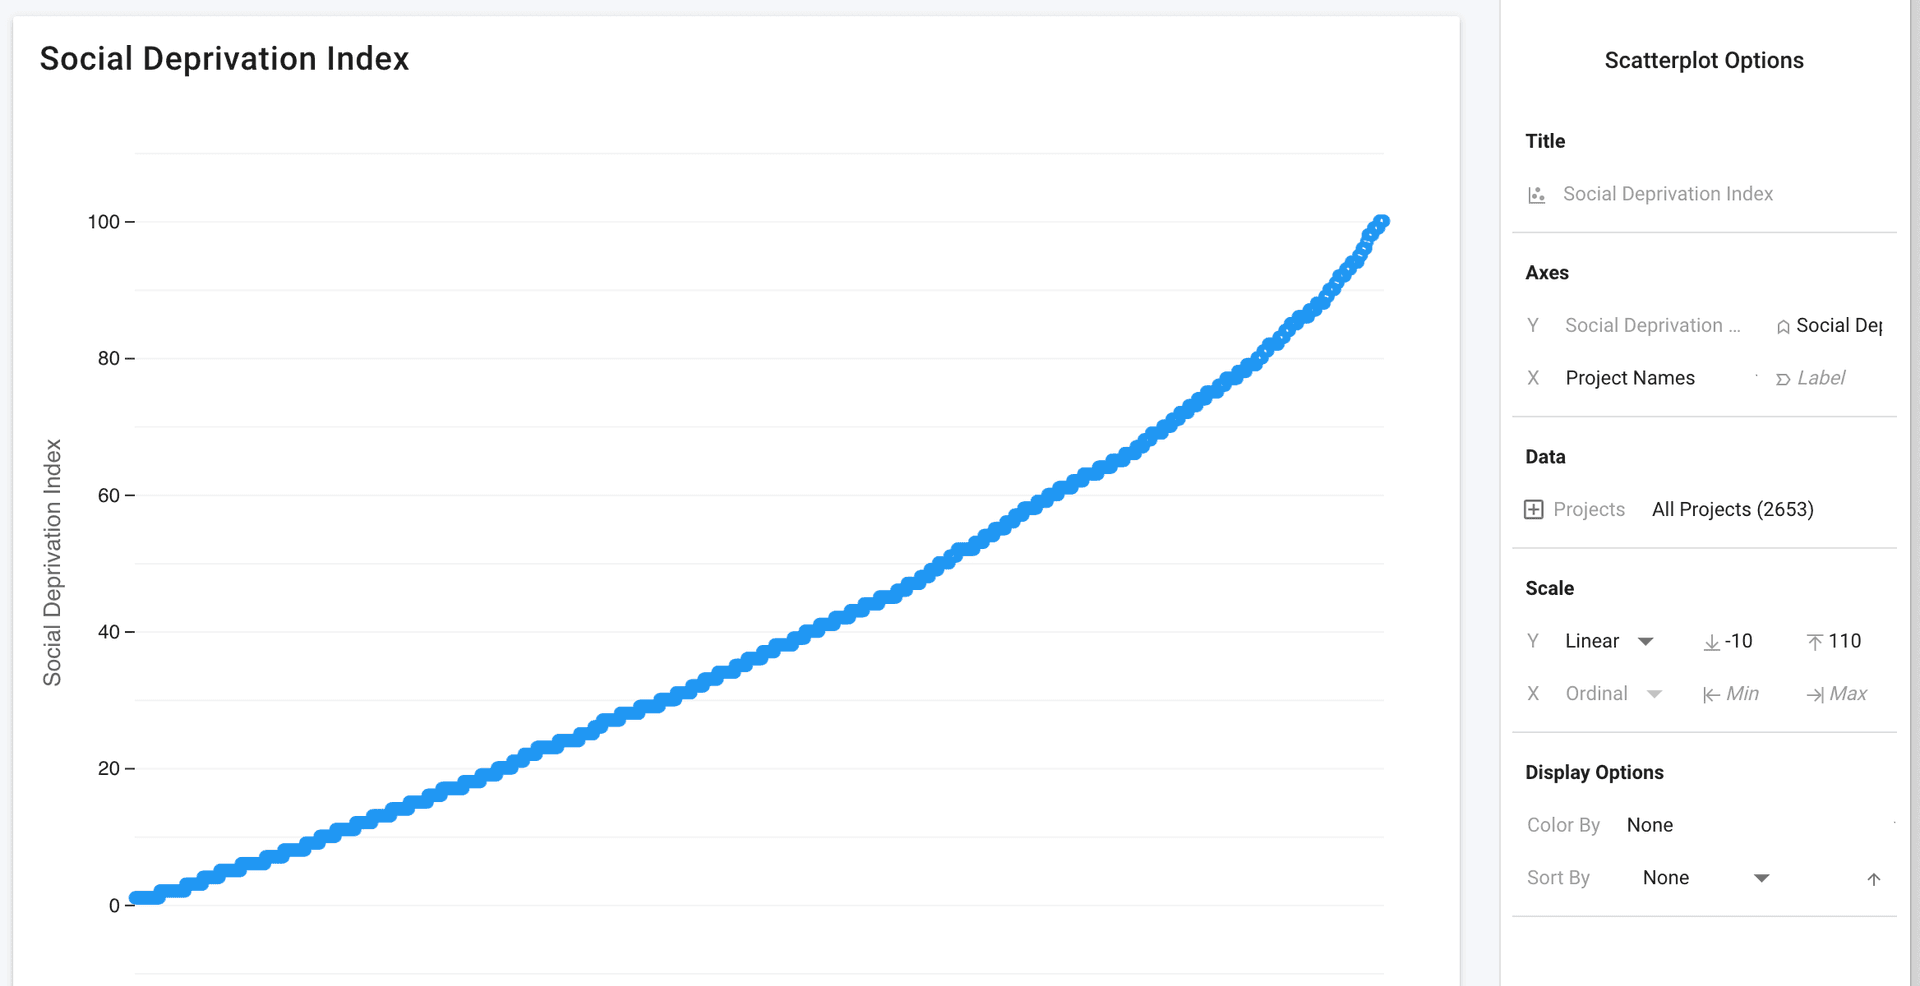
By default all project attribute scatterplots will be plotted with projects as the X axis and sorted from smallest to biggest. This gives you a good look at the overall data but often it's useful to customize the chart further.
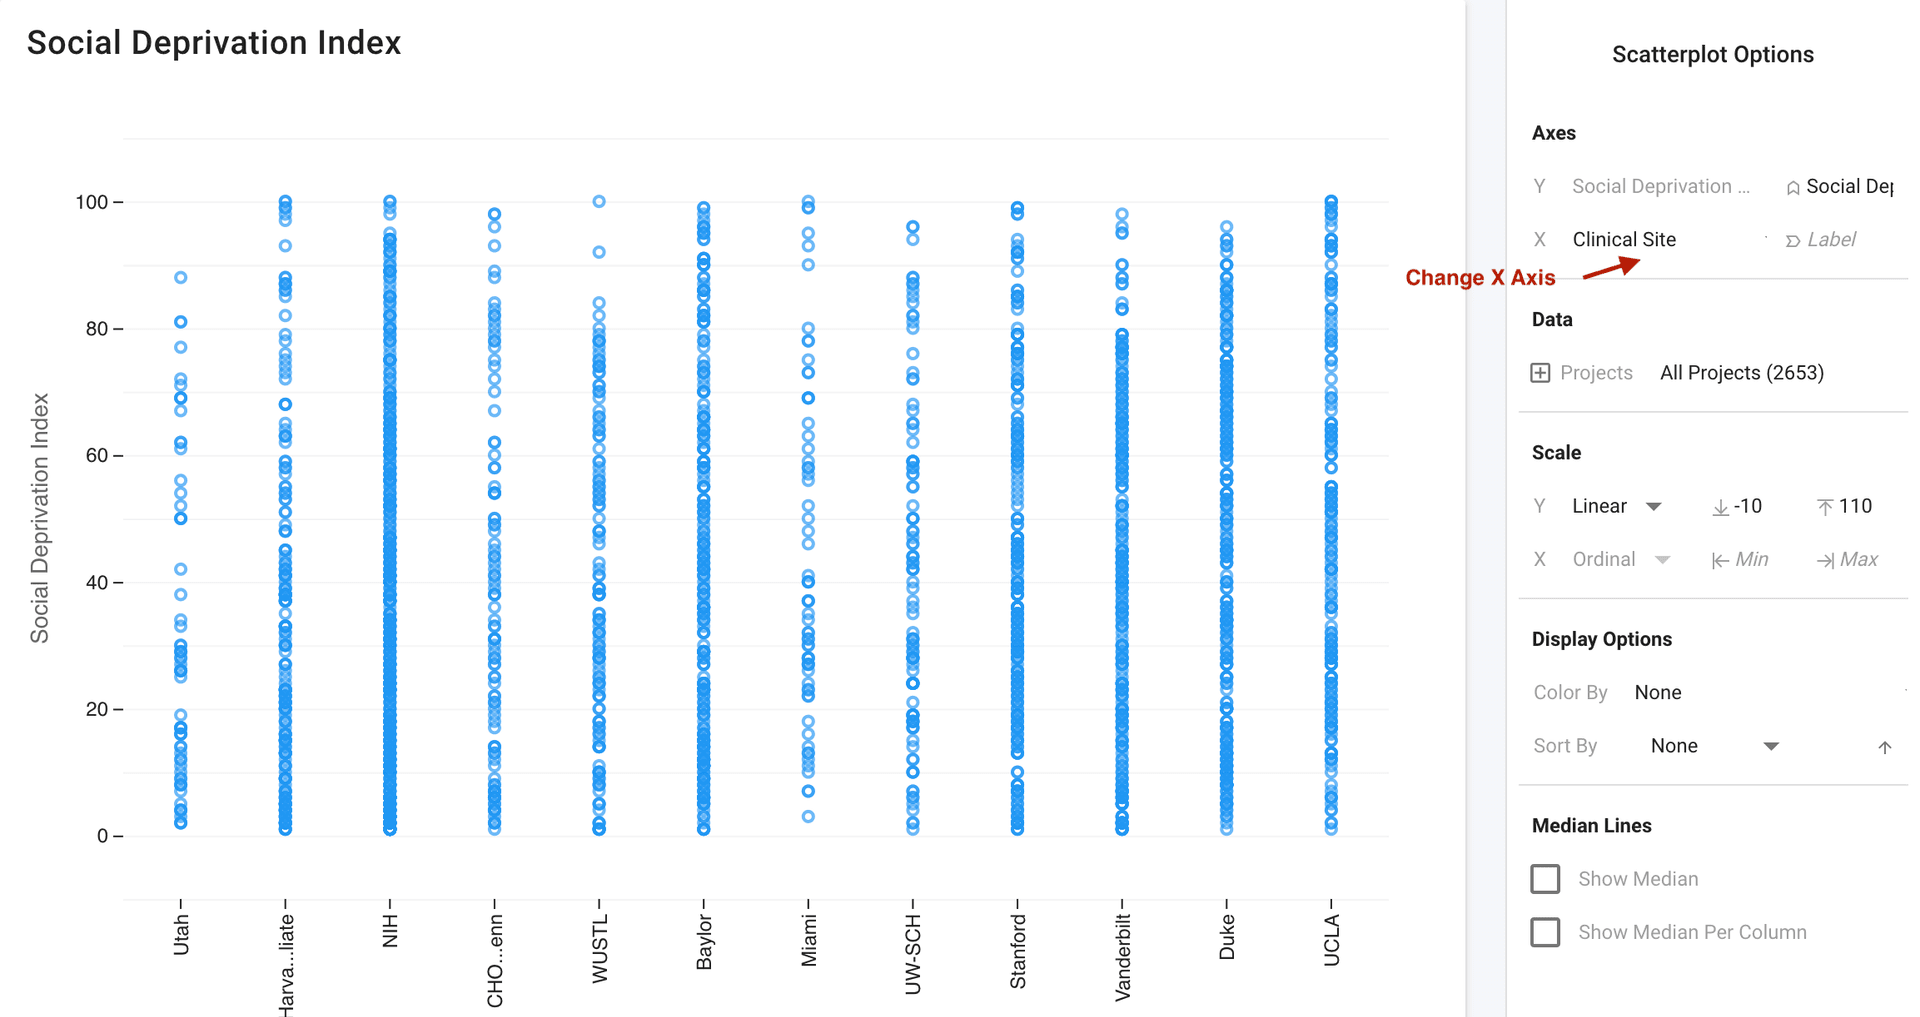
One customization is changing the X-axis. For this project we can change it to Site-Location, which is a "text" type of attribute so we'll see a number of columns for each unique value of site location.
Add Median Line
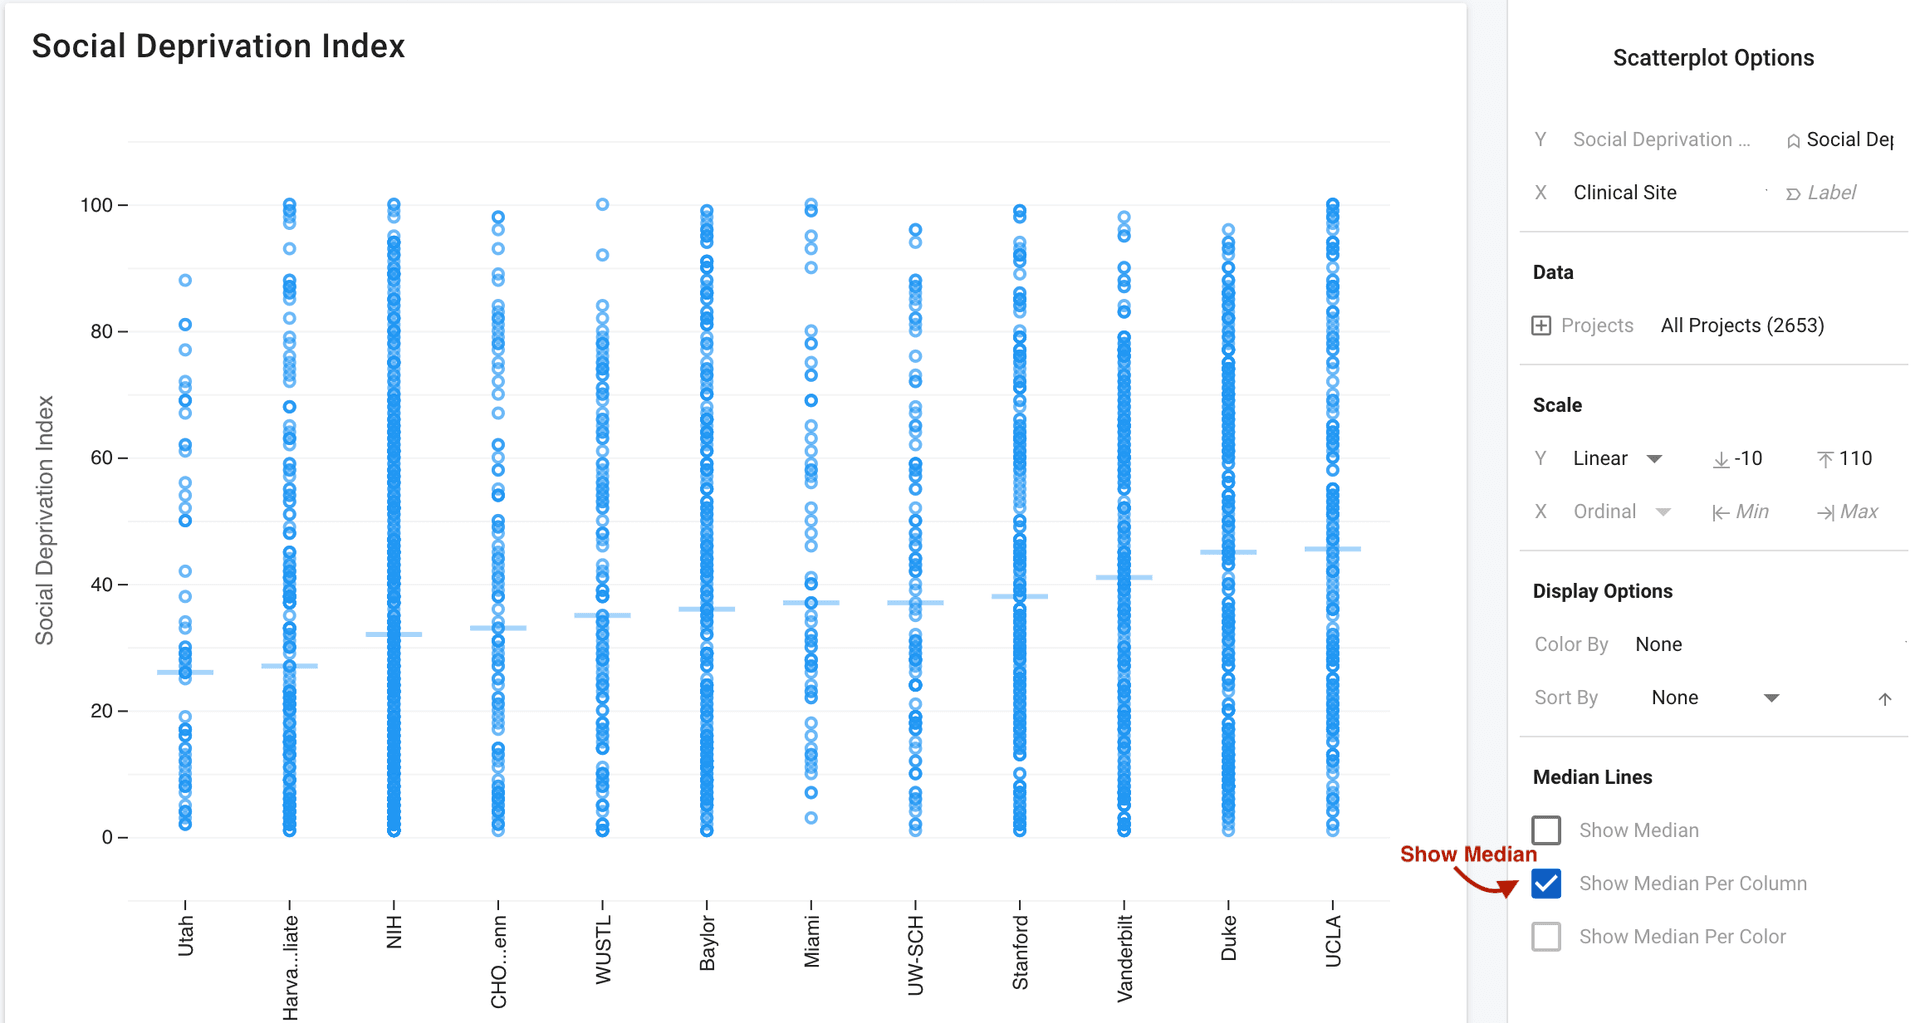
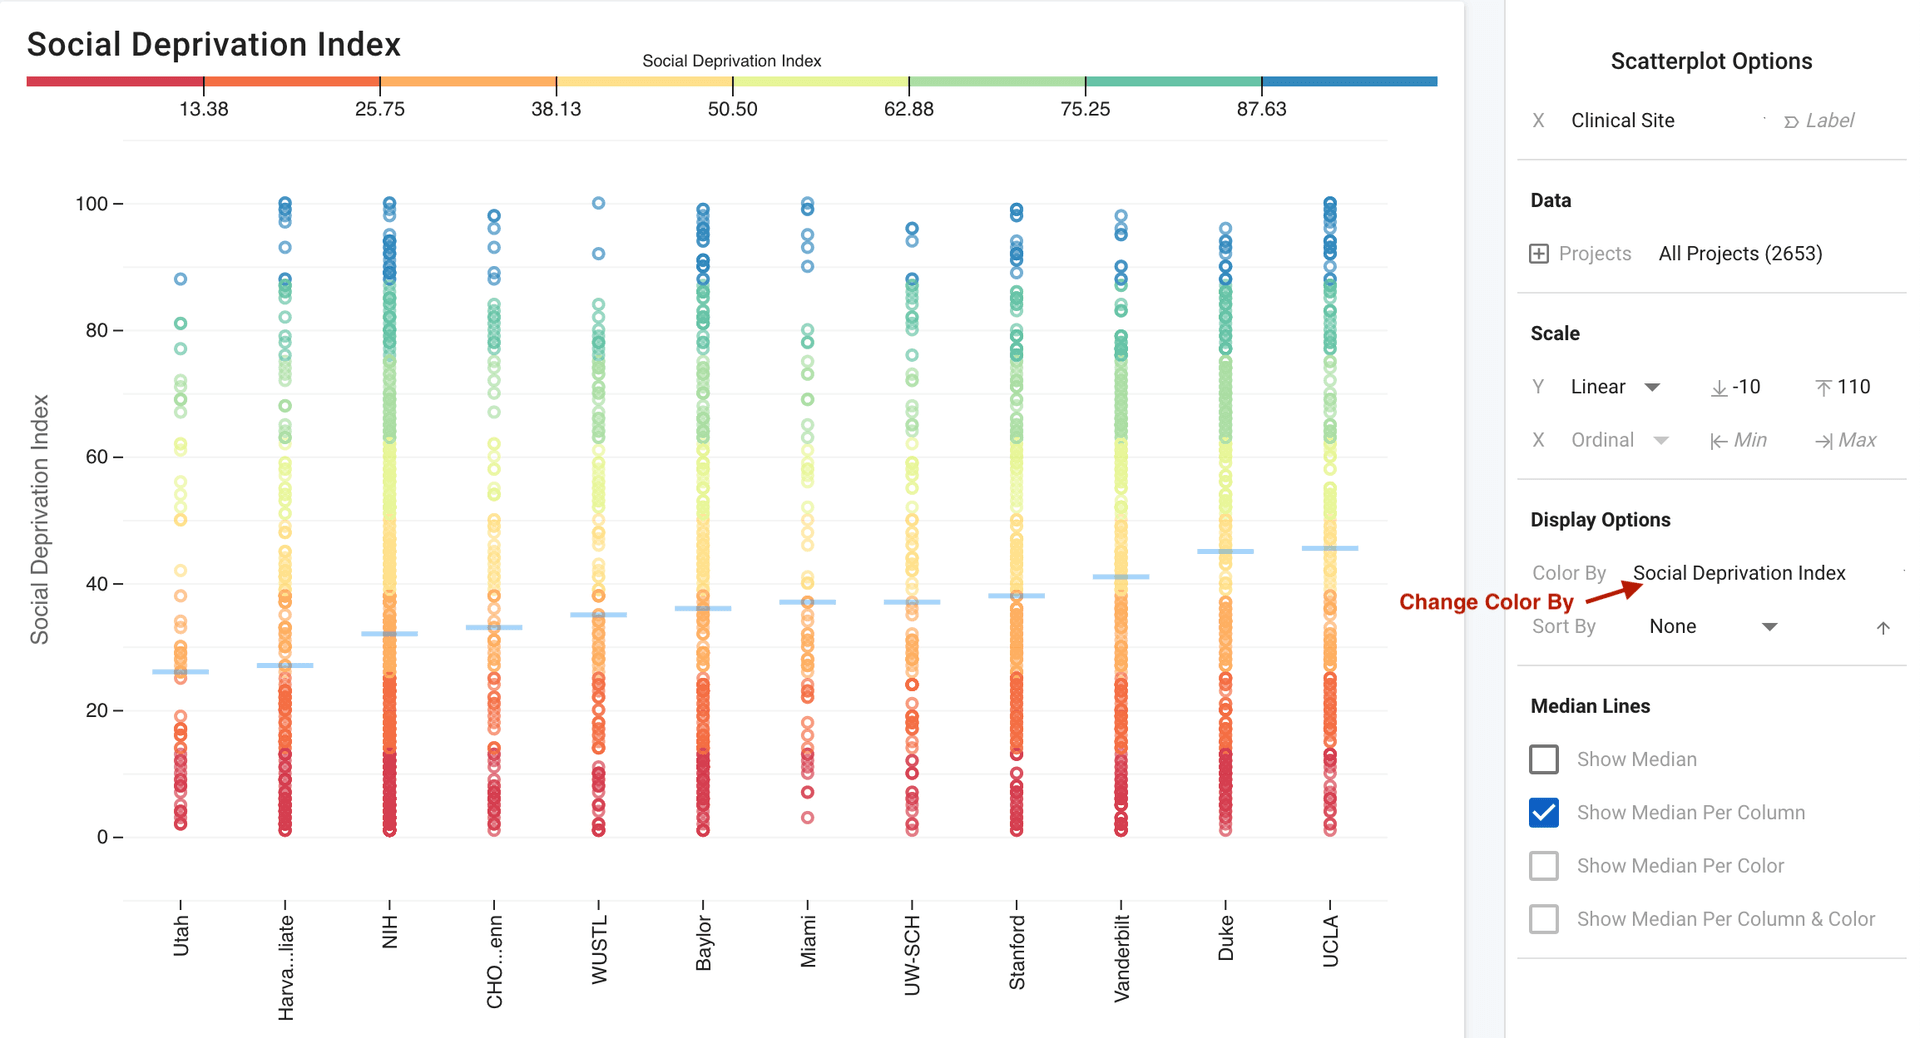
This gives us a look at the SDI data by location to see if there are any differences. This is still a little hard to read so let's go ahead and add a median line for each column. This shows us that the SDI is pretty consistent between all sites.
Add Color
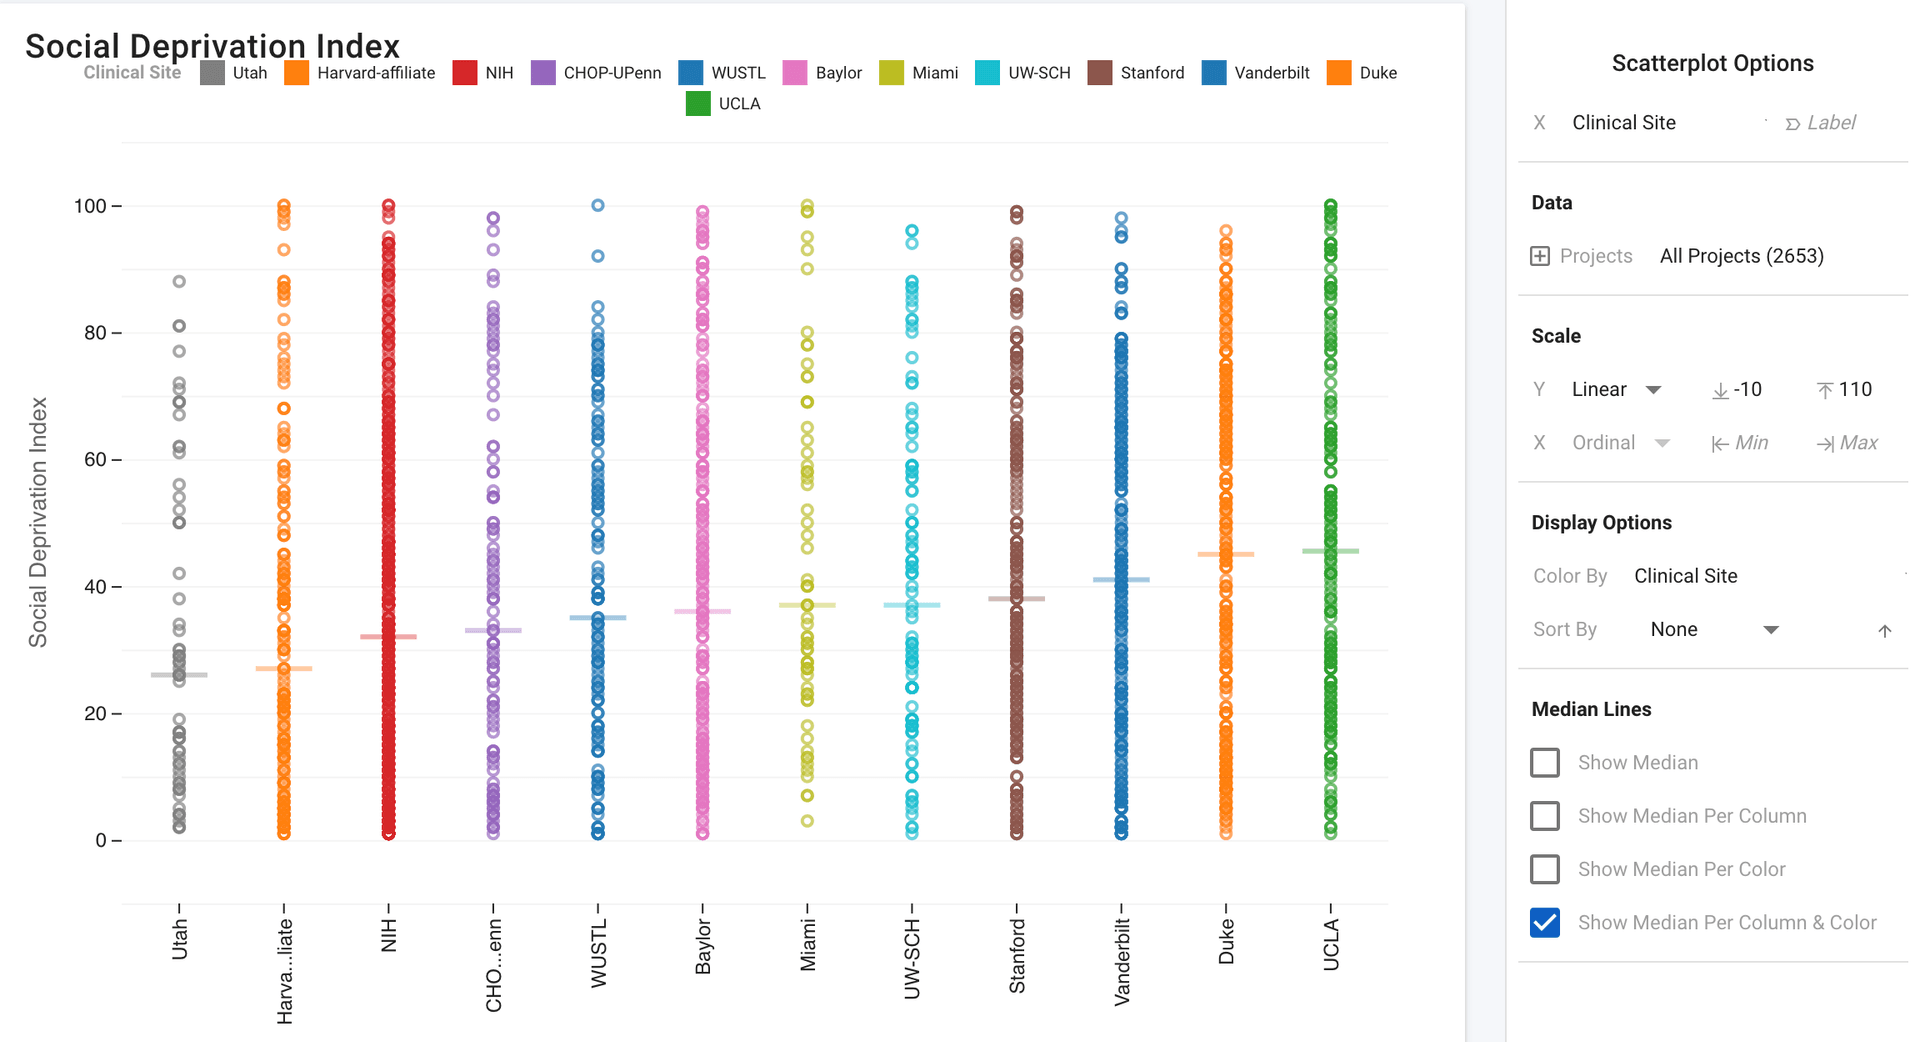
Finally, let's add some color to make the chart a little clearer and nicer to look at. First let's try coloring by SDI. SDI is number-type attribute (i.e. the values are numbers) so the color legend will be a continuous scale.
This doesn't really add much so instead let's change the color to the site location to just add some clarity to the overall chart. Since the site-location is a text-type attribute (i.e. the values are text, e.g. 'NIH') the legend will be swatches with a swatch for each location. Also just to clean things up further, we can go ahead and change the median to 'Per Color & Column', which will in this case color the median to the same color as the column.