Working with timestamps
What are events and intervals?
- Project events: A stored timestamp recording the time of a specified event.
- Project intervals: The elapsed time between two project events.
Mosaic uses events and intervals to easily store timing information about common events in projects. In this tutorial, we will learn how to create / import events and intervals into projects and how to visualise timing information across projects in collections.
Creating events and intervals
As of the time of writing, project events and intervals can only be created via the API. Please contact Frameshift for aid in creating new timing information in your projects.
Setting timing information
In the Timing tab of the Project Home page is a list of all available events and intervals. The top table shows all the events and the assigned times. If no time has been set for an event, the Set As Now will be present to allow the current date and time to be assigned to the event. If an event already has a value, you can edit the time to any value (clicking Edit Time will open a modal where the date and time can be modified), or reset to the current time.
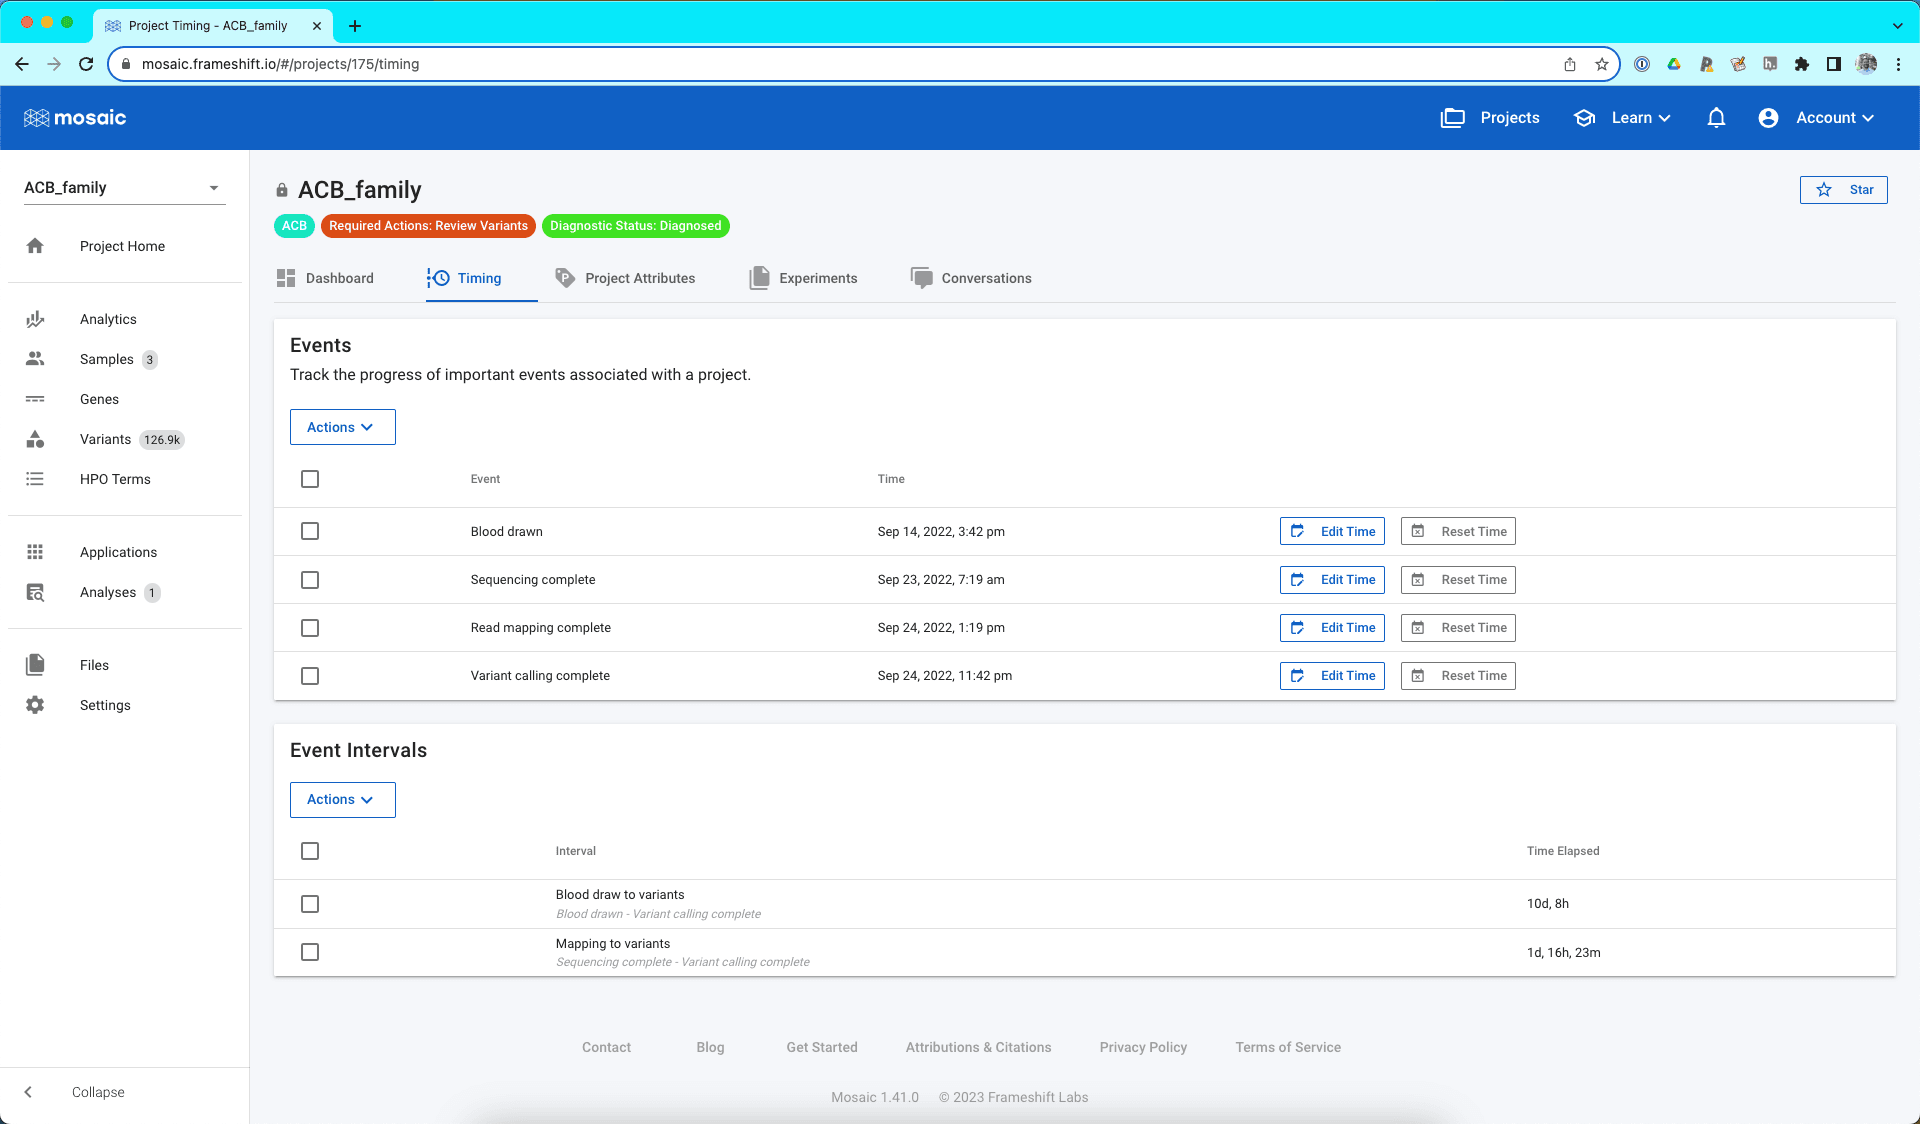
The second table shows a list of all available intervals. Underneath the user defined interval name, the start and end intervals that define the interval are defined. In the example above, the Blood draw to variants interval is defined as the time between the Blood drawn and the Variant calling complete events.
Deleting events and intervals
You can select as many events / intervals from the tables as required and select Delete from the Actions menu button to remove them from the project.
Visualising timing information
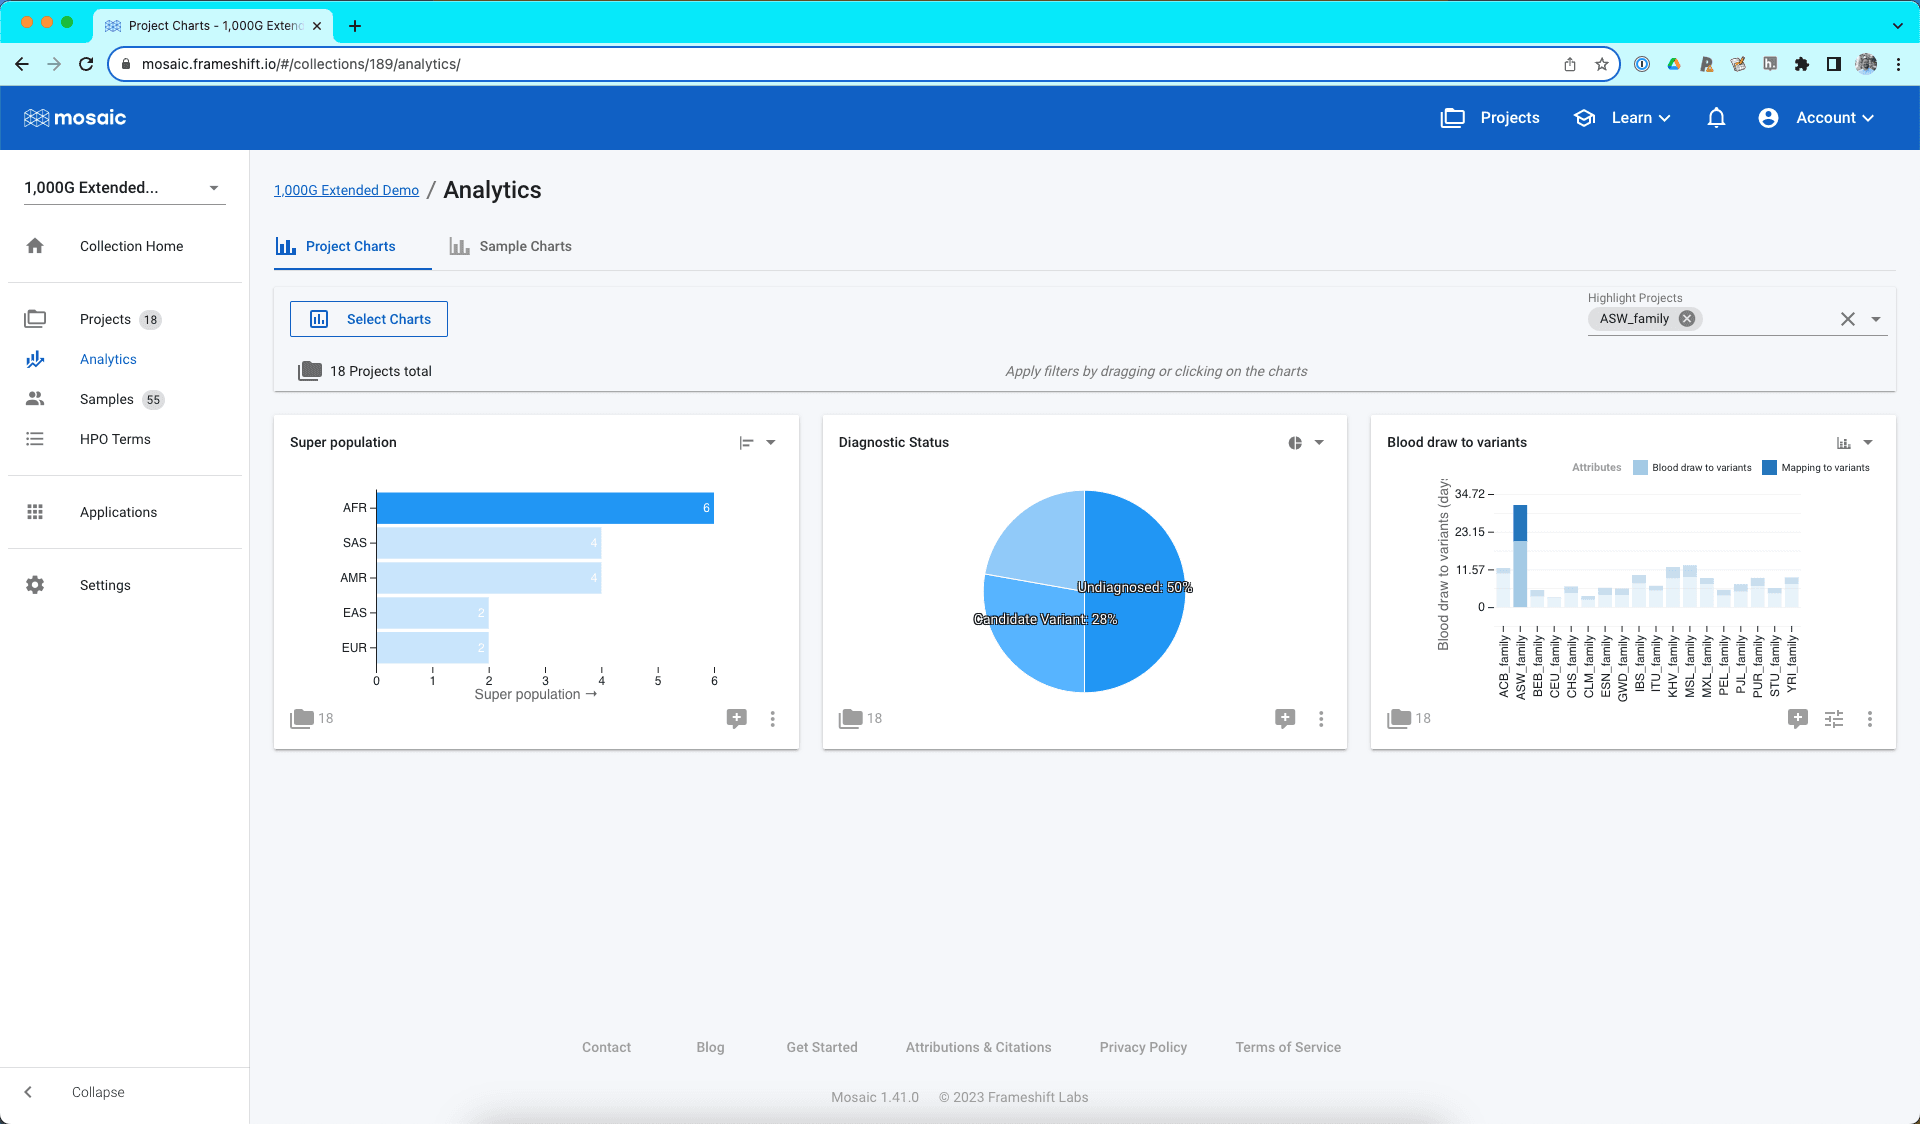
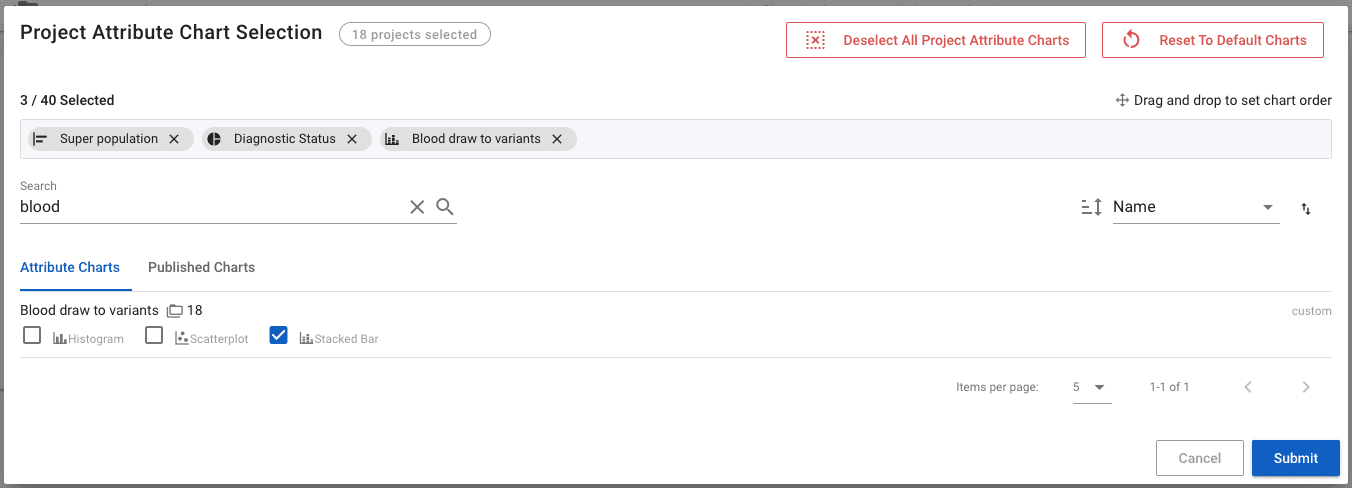
The 1,000G Extended Demo collection includes timing information for all of the constituent projects. Timing information can be charted in the Analytics section just like any other attributes. On the Analytics page, click Select Charts, search for "blood" and select the Stacked Bar option.
This will create a new chart showing the time distribution (in days) for how long the blood draw process took for these projects (note that this is fictitious data for demonstration purposes only).
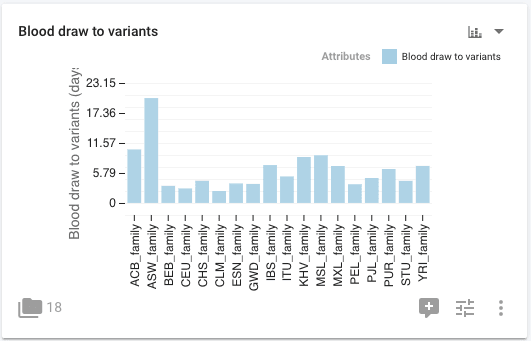
We recorded multiple time intervals for all these projects and we can see them all on the same chart. Click the three vertical dots at the bottom right of this chart and select Fullscreen. In the controls at the right, we can add as many available intervals to the chart as we like in the Stacked Attributes section. Click the + symbol to bring up a list of available intervals, and select the Mapping to variants - the only other available interval in this demo.
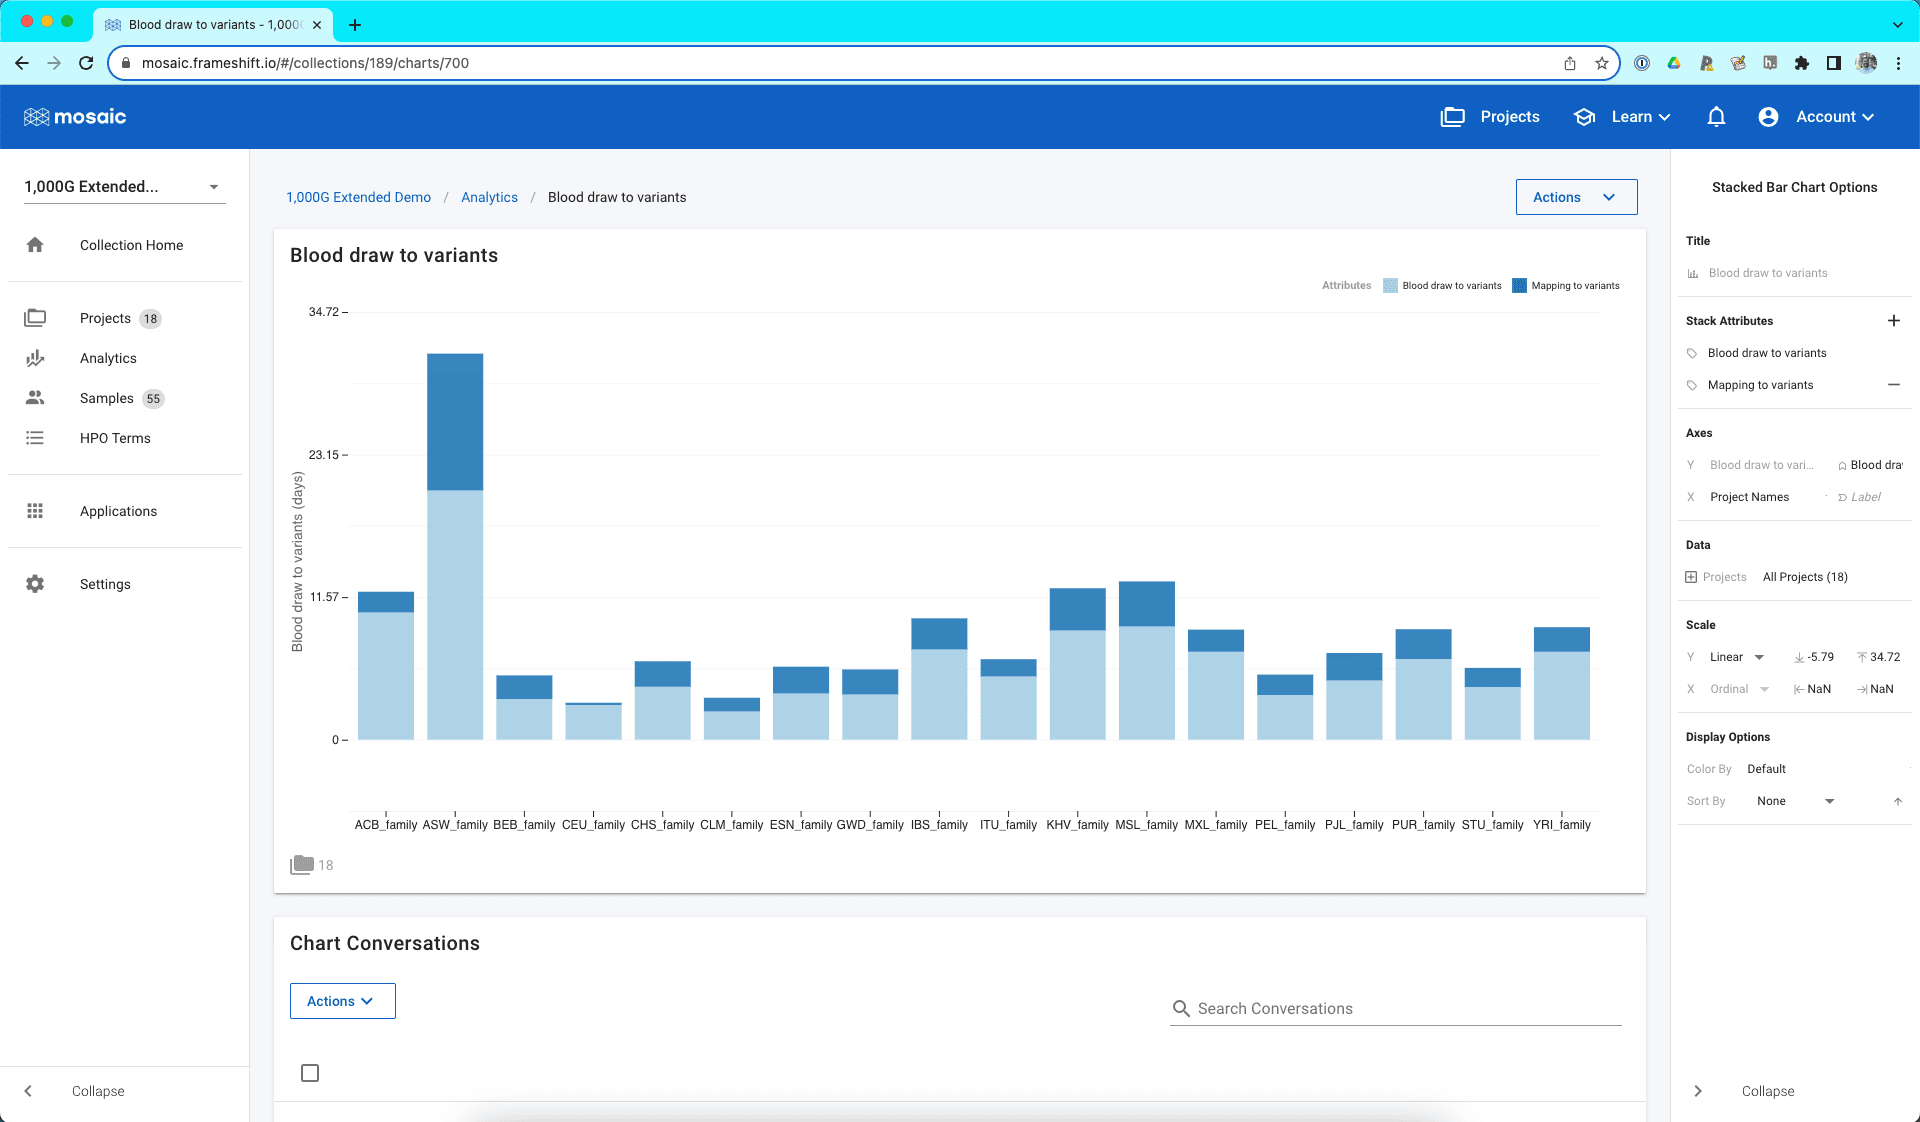
Returning to the Analytics page, this complete chart is now shown. As a final demonstration, the ASW_family has been highlighted by selecting it from the Highlight Projects field at the top right. We can see information about this family highlighted across all charts and can see that this is an outlier in the timing chart as it has taken significantly longer to process than the other families.