1,000 Genomes Project Exploration
In this tutorial, we will use Mosaic to explore the 1,000 Genomes project low coverage whole genome sequencing data. There are many publications on this dataset, so we will explore this data and find some results noted in these papers:
- A global reference for human genetic variation, 1,000 Genomes Project Consortium, Nature 526, 68-74(2015) https://www.nature.com/articles/nature15393
- Genome measures used for quality control are dependent on gene function and ancestry, Wang J. et al, Bioinformatics. 2015 Feb 1; 31(3): 318-323.https://www.ncbi.nlm.nih.gov/pmc/articles/PMC4308666/
Select the project
After logging into Mosaic, you will see all the projects that are available for you. Even if you haven't got data of your own, you will have access to public projects, including the 1,000 Genomes project. Let's get started by clicking on the 1,000 Genomes Project in the table and you will be taken to this project's dashboard.
Project dashboard
Here we can see some high level information about the 1,000 Genomes project, for example, there are 2,504 samples in this project and the data is associated with the GRCh37 human reference genome. To explore the data in more detail, we can click on Analytics in the left menu.
Analytics
The analytics page is where we can really start to explore the data. Distributions of all metadata, quality data, or phenotypic data attached to the 1,000 Genomes samples can be viewed here. We can choose which data we want to see by clicking on the "Select Charts" button. You can search through several pages of available attributes and choose to show or hide whichever ones you want; but for this tutorial, make sure that the Het Hom Ratio, Population, Sex, Super Population, and Variant Count are selected. Click Submit to return to the charts. Immediately, we can see there is structure to the Het Hom Ratio and Variant Count distributions.
We might wonder if there is a quality issue that is leading to a difference in the number of variants called. To test this, we can select only the samples that have the lower number of variants, by dragging over the lower left of the Variant Count distribution. As soon as we make a selection on a chart, a filtered chart will drop out from beneath every chart. This allows us to quickly compare the distribution of each attribute for all samples in the project, and those that have been manually selected. So now we can see that all the individuals with a smaller number of variants are male.
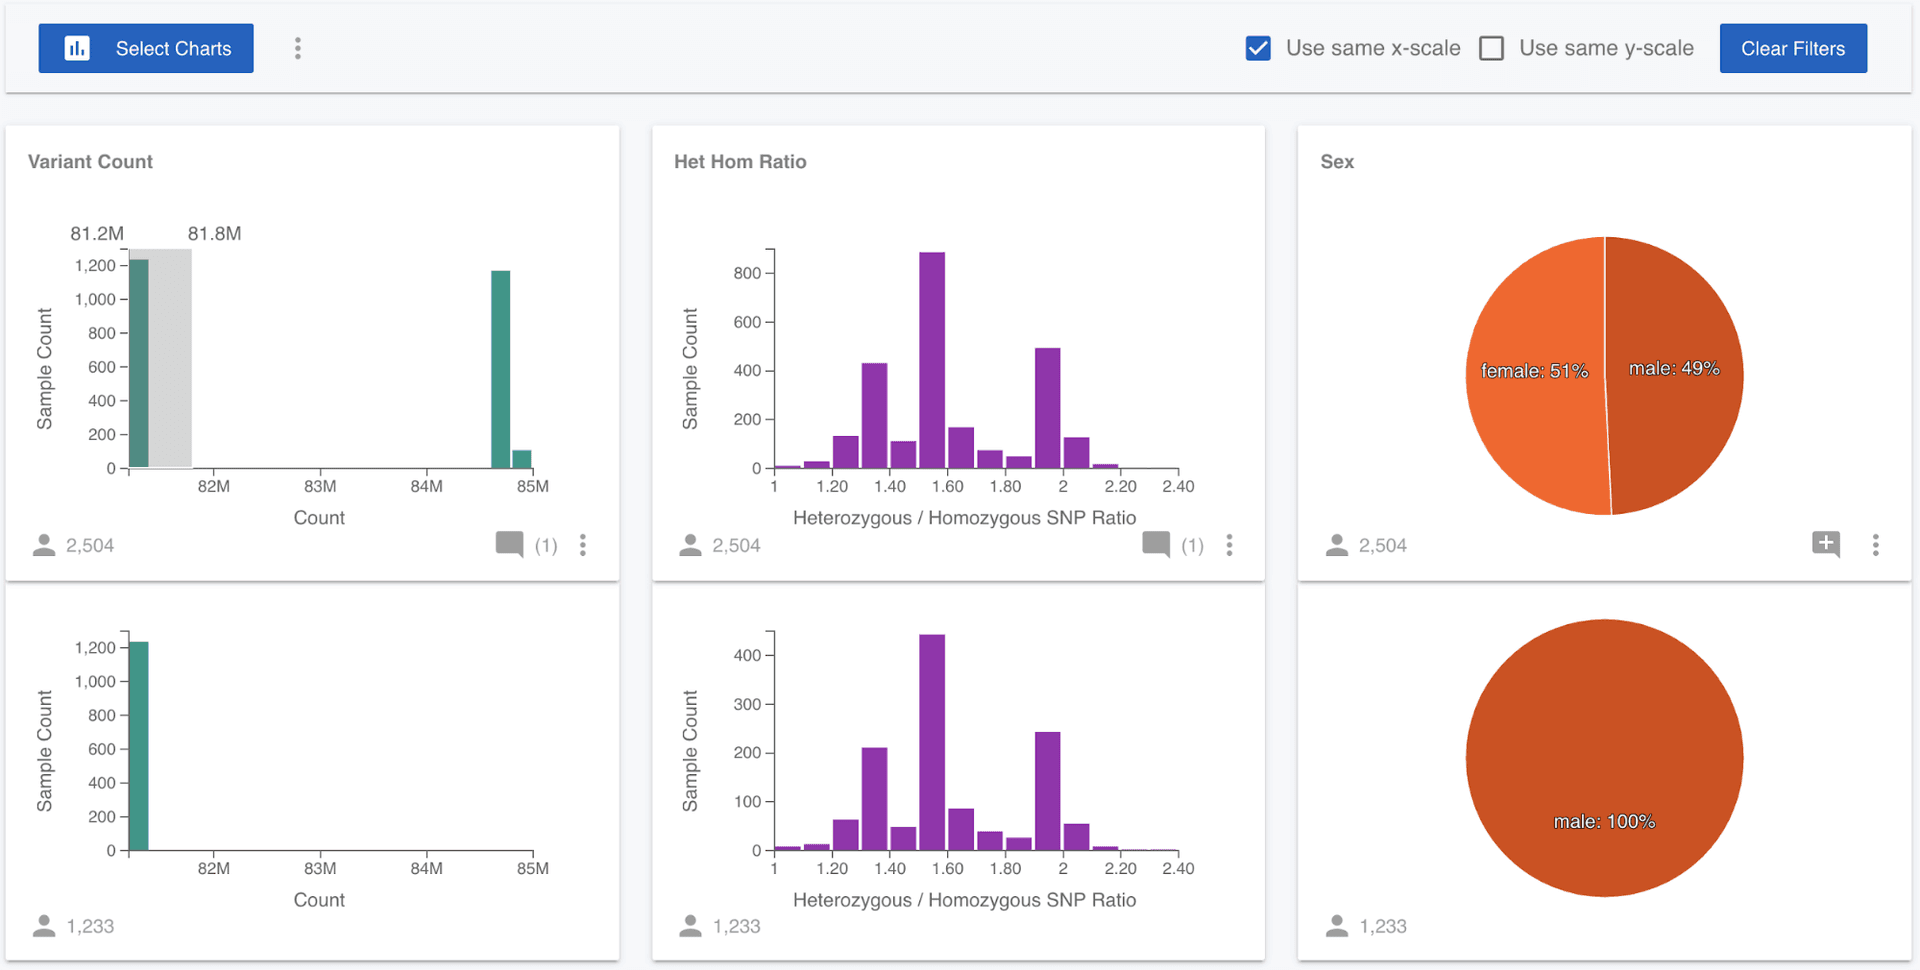
None of the 1,000 Genomes samples have genotypes called for the Y chromosome, only the X chromosome. Since males only have one X chromosome, they have significantly fewer variants called on the X chromosome than the females do. It would be nice to test that this is really the cause of the difference. Luckily, Mosaic lets us add attributes to projects, so we can test this! (Note that you have been assigned a Viewer role to the 1,000 Genomes Project, which means you have read-only access and can't edit this project, but you can with projects where you have more permissions.) I quickly generated stats on the 1,000 Genomes variants (VCF) file for all samples and created a csv file containing the sample name, the number of heterozygous and homozygous non-reference SNPs for all samples and then uploaded this file to Mosaic in Attributes on the left menu.
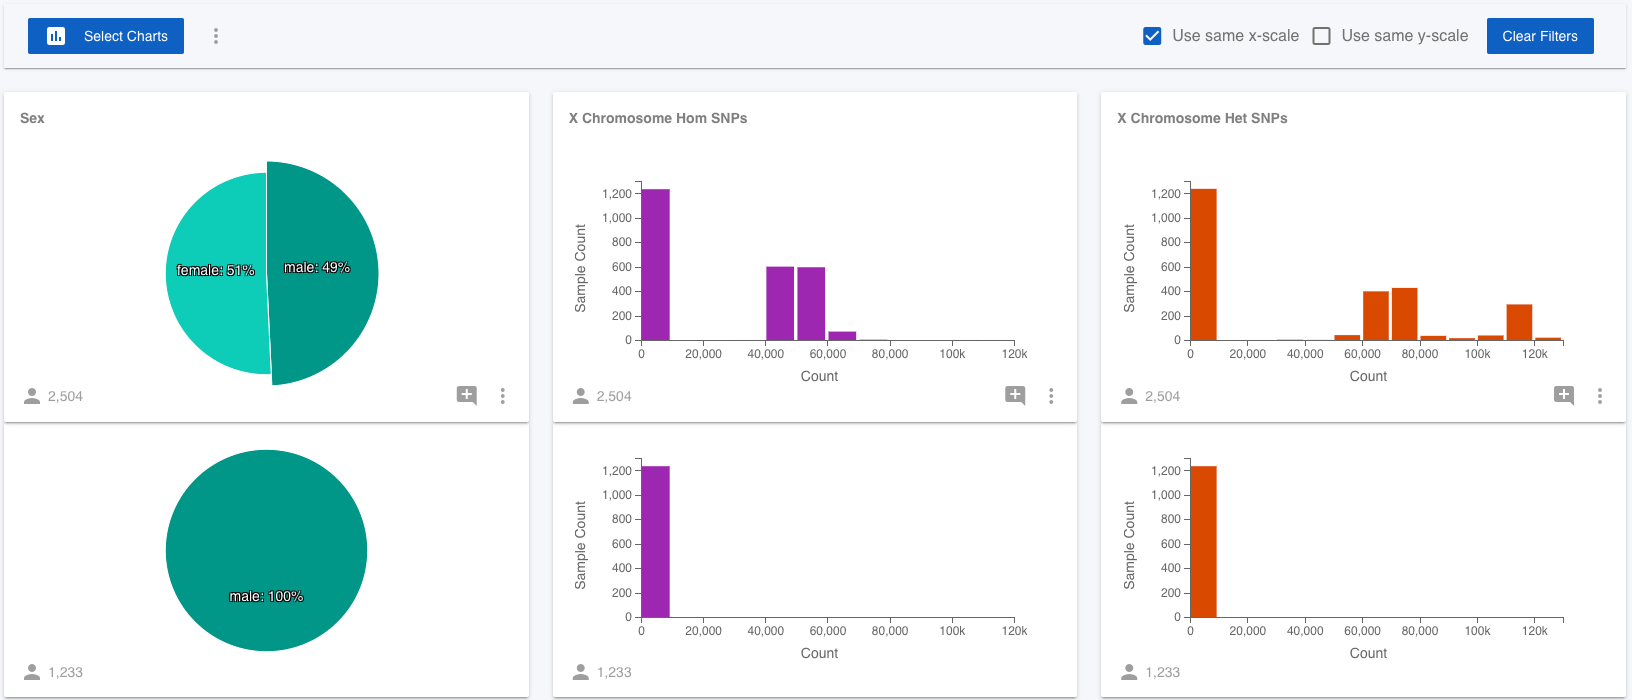
You will find the X Chromosome Het SNPs and X Chromosome Hom SNPs charts available to view in the Select Charts modal. Using these attributes, we can easily confirm that the male samples all have far fewer SNPs on the X chromosome that the females. Even with the raw data at hand, and the ability to use standard charting software, it is far quicker to use Mosaic to add new attributes and test these hypotheses and observations.
Next, we might hypothesise that the ratio of heterozygous to homozygous non-reference SNPs stratifies with continental ancestry. To test this, we can select only those samples in the right hand tail of this distribution, by dragging on the Het Hom Ratio chart.
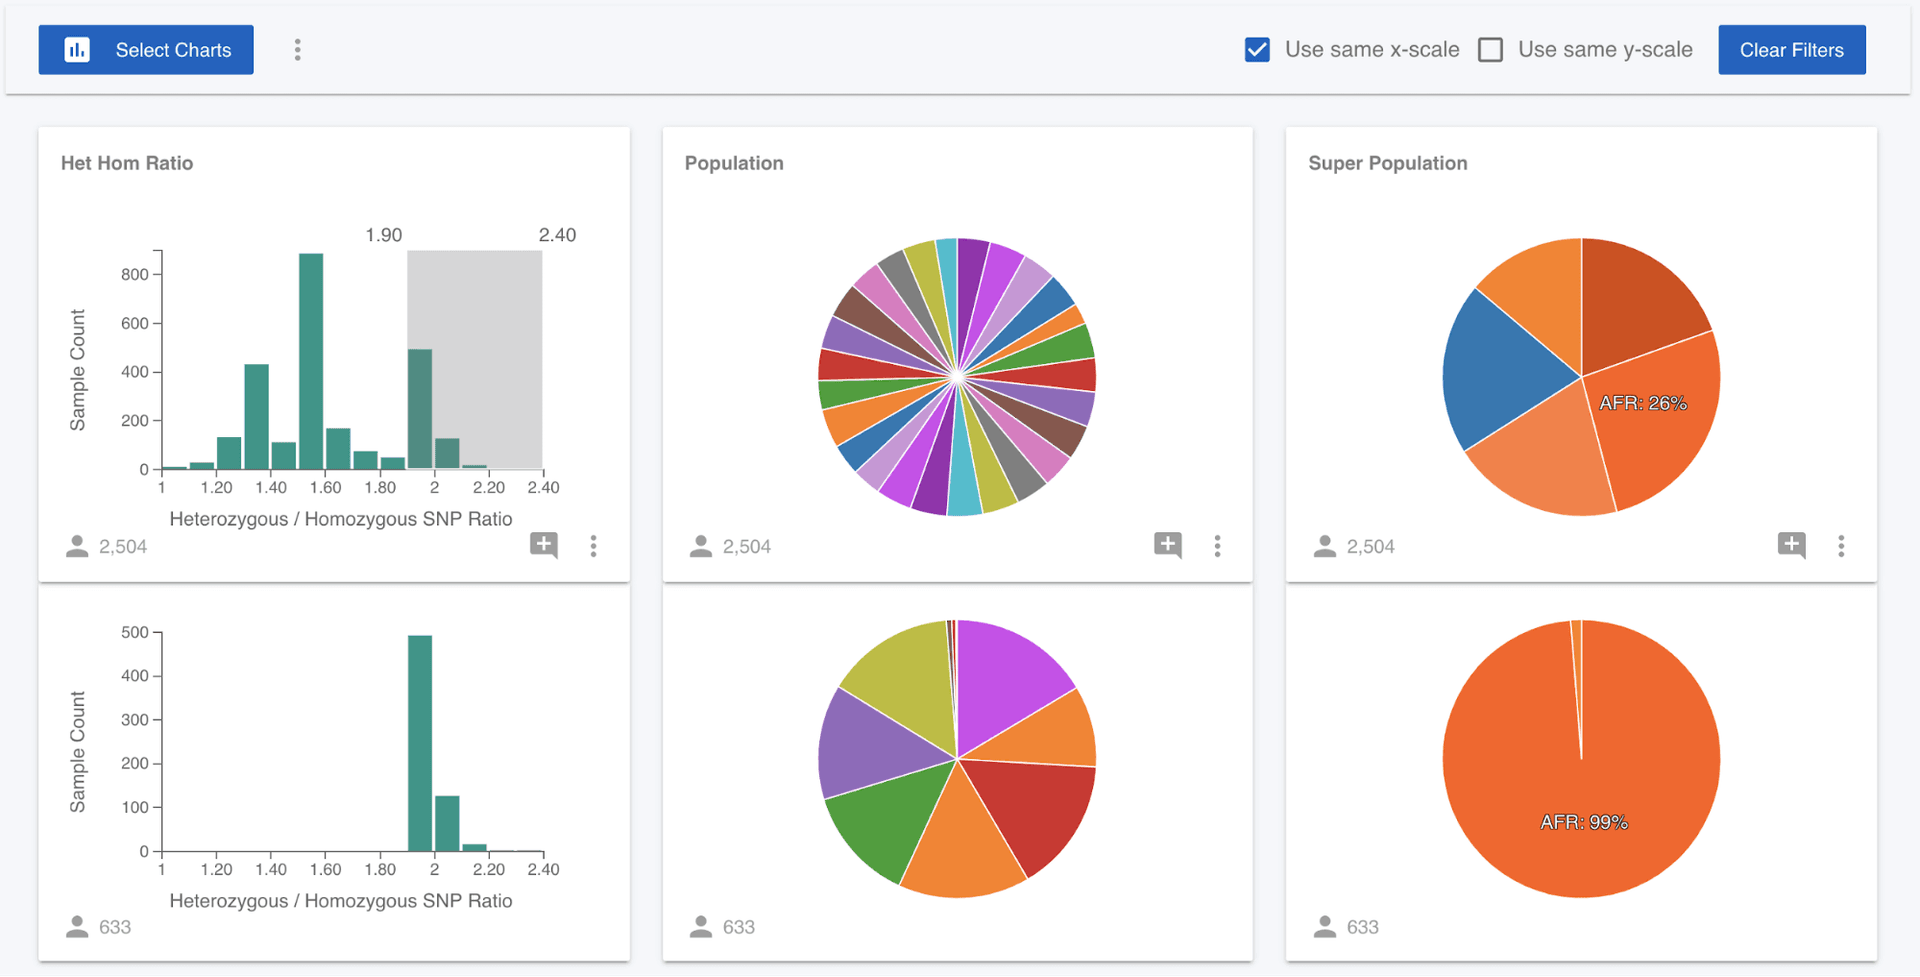
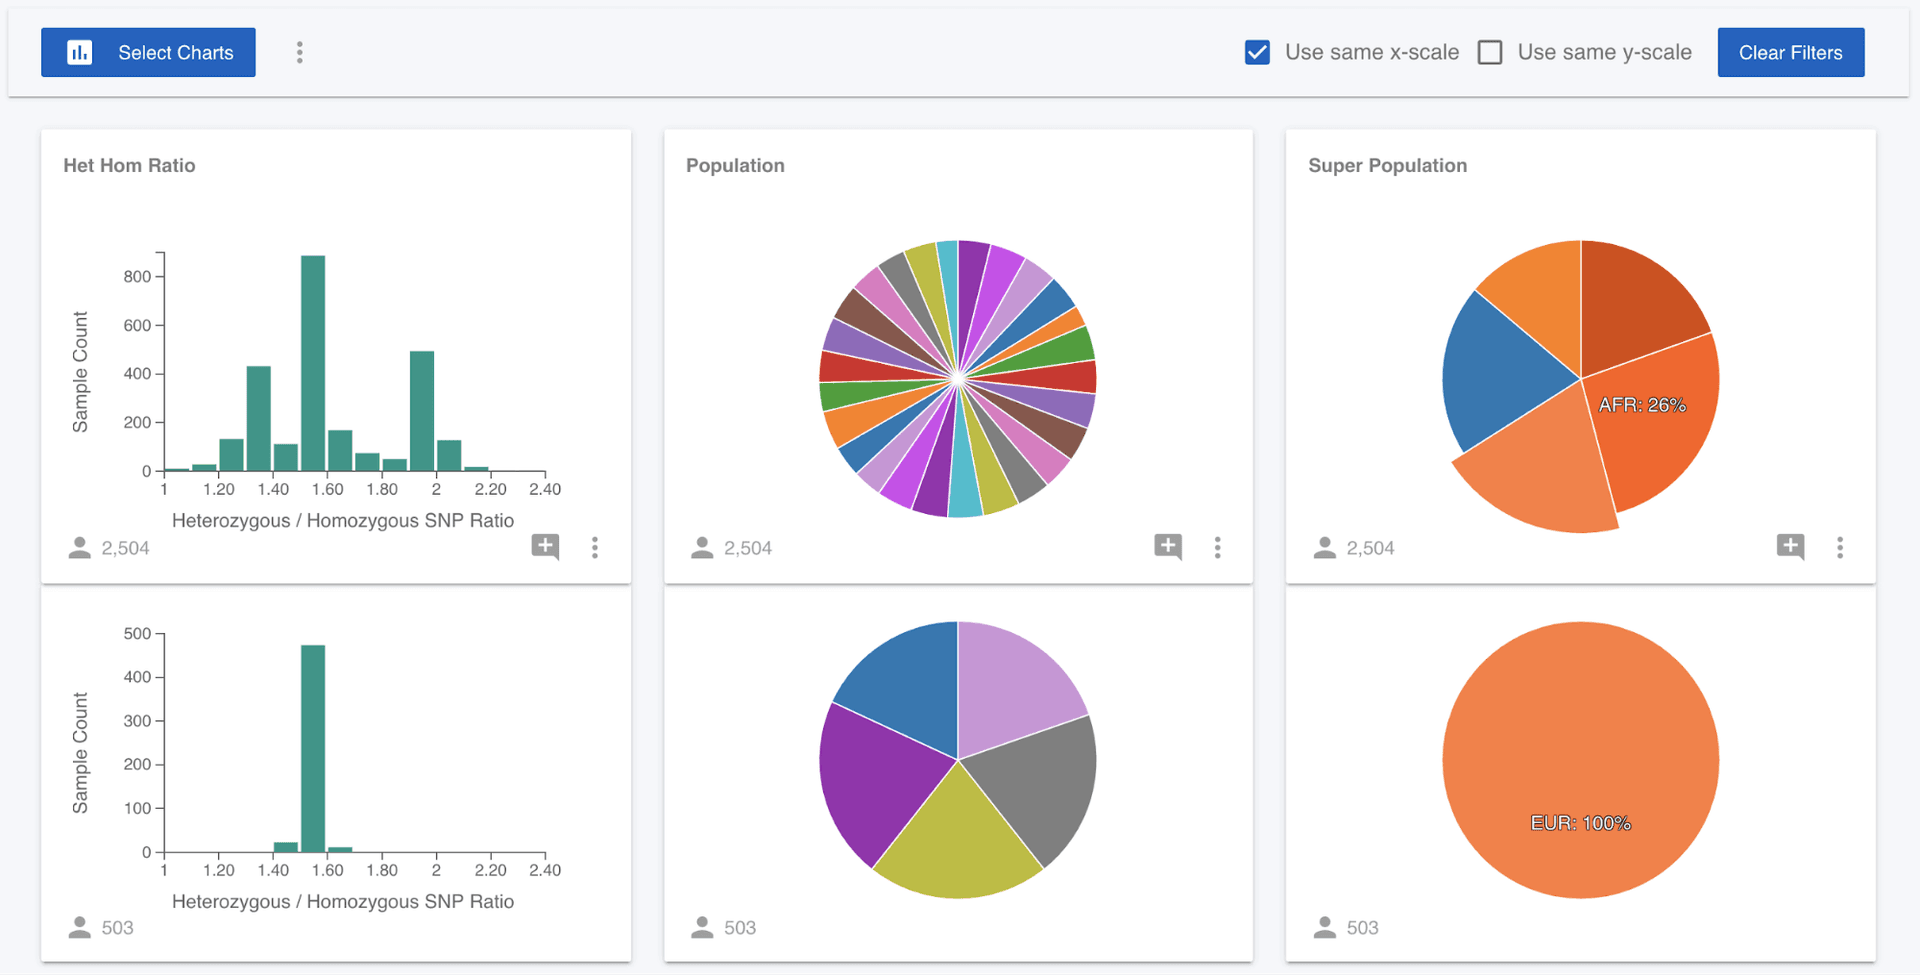
What we can now see is that 99% of the samples that have a het hom ratio of greater than 1.90 are of African (AFR) ancestry. We could come at this question from a different angle and ask if European (EUR) samples are localised in the distribution. We can clear the filter we have applied either by clicking on the Het Hom Ratio chart, or clicking the "Clear Filters" button. Then click on the EUR wedge in the Super Population pie chart and we can see that the European samples are focused around a value of 1.50.
The more attributes available in a project, the more exploration we can perform. New attributes can be added to the project (from the Attributes left menu). The brief data exploration here is focused on phenotypes, but we often want to ask questions focused around variants and genotypes. Mosaic lets us explore genetic variants and connect samples with requested genotypes to these phenotypes or metadata attributes.
Genetic Variants
Begin by clearing all applied filters, then click on Variants in the left menu and we see a table containing variants. The free version of Mosaic gives us the option to filter on a limited set of annotations, namely, a genomic region (gene); gnomAD allele frequency; ClinVar pathogenicity; or the variant type. Before filtering samples based on their genotypes, we need to restrict ourselves to a manageable number of variants (less than 1,500). In the Nature paper "A global reference for human genetic variation", it was observed that there might be a novel selection signal in the TRBV9 gene, meaning that there are variants with large allele frequency differences between populations. So, first of all, let's see what variants there are in the TRBV9 gene by entering the gene name in the Gene field, then clicking the "Apply Filter" button.
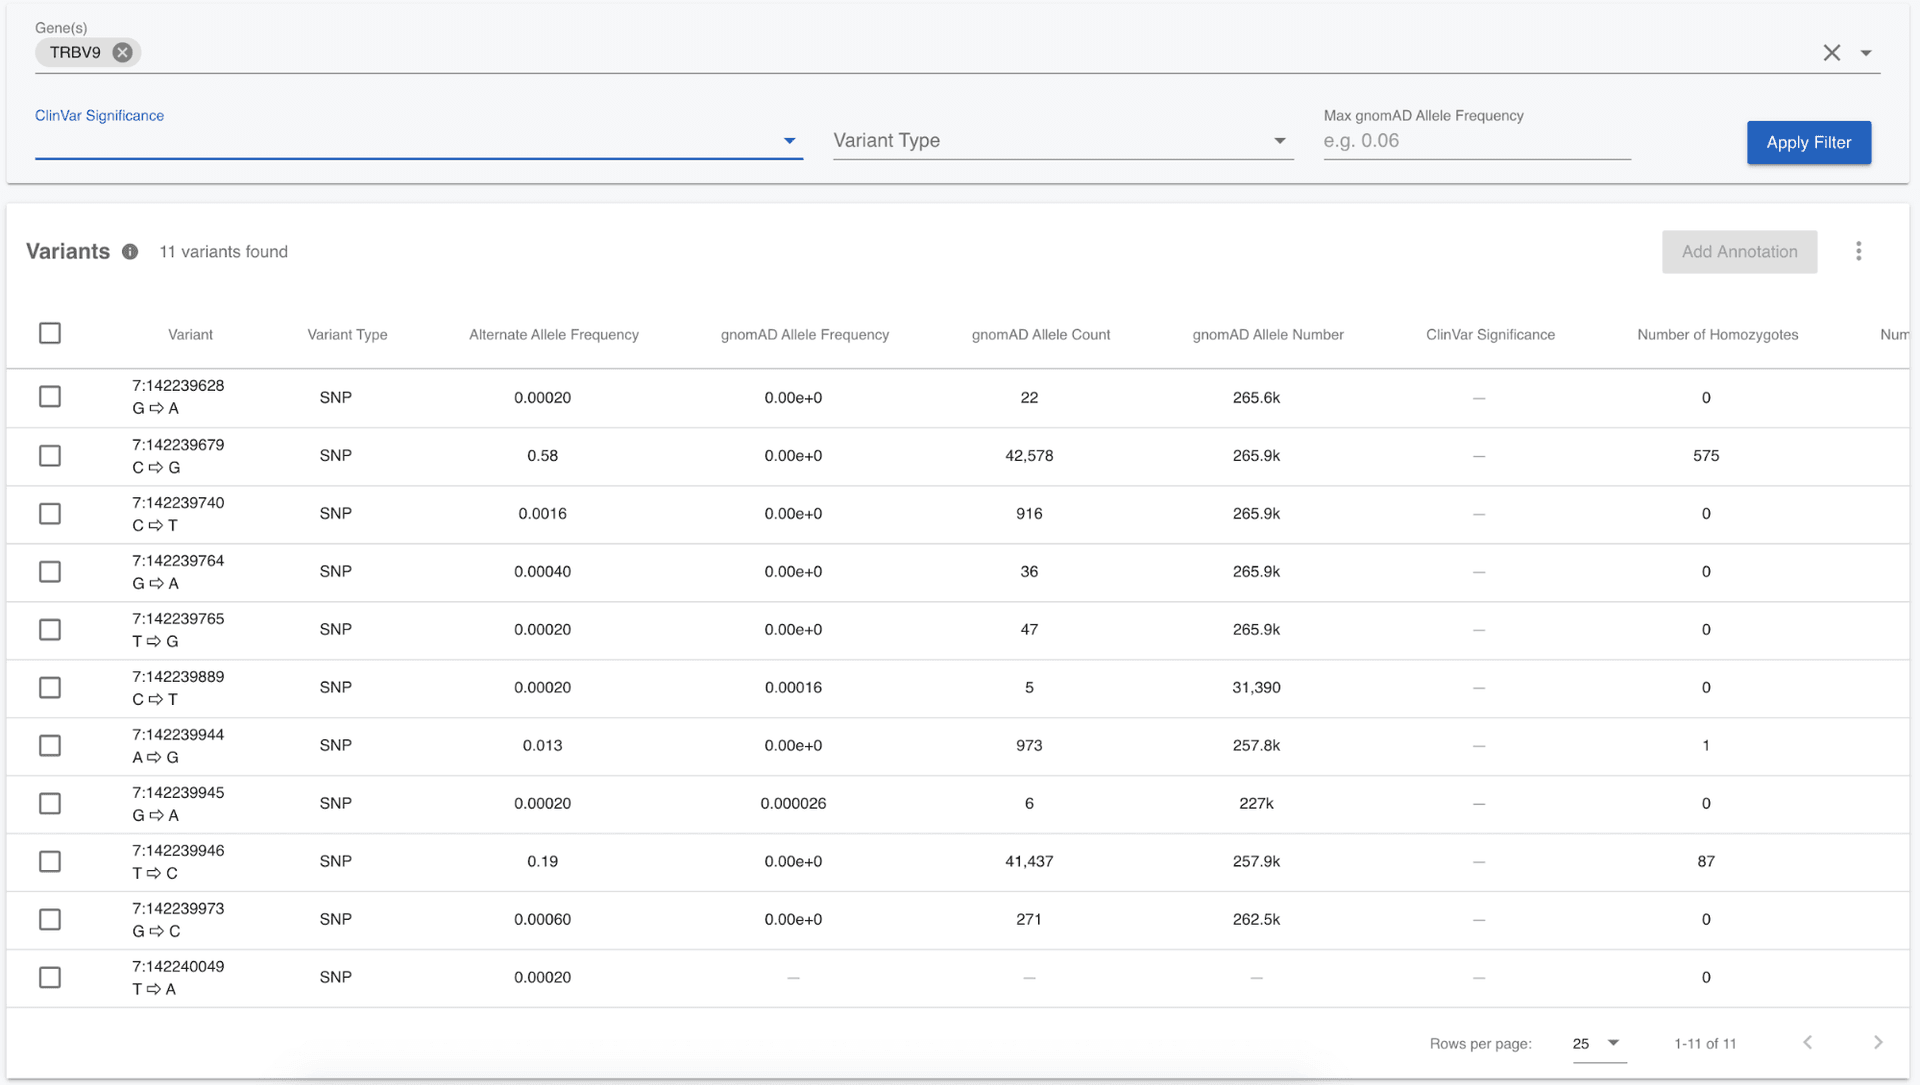
We can see there are only 11 variants in the entire 1,000 Genomes call set for the TRBV9 gene, so there is no need to filter further. We can note from the table that most of these variants are rare; most of them have a gnomAD allele frequency of 0.0038 or less, meaning that they are seen in less than 0.38% of the chromosomes. I would like to see which samples are homozygous for any of these variants. We can quickly do this by first selecting all of the variants using the checkboxes to the left of the variants (or selecting them all at once using the checkbox in the title row), then clicking the Filter Samples by Genotypes button at the top right of the Variants table. In the modal that pops up, select only homozygous genotypes.
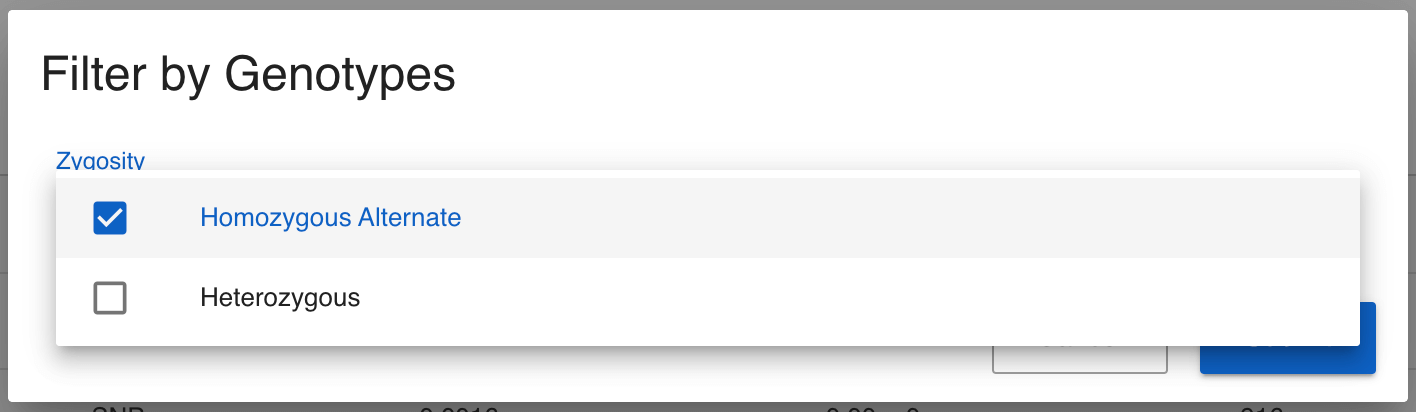
Click Submit and we are taken to the Analytics page and all charts have been filtered to show the samples that harbour homozygous non-reference variants in the TRBV9 gene. Feel free to explore all available data here, but one observation we can make is that 48% of the samples with these variants are from South Asia (SAS). This is a significant enrichment; only 20% of the 1,000 Genomes samples are from South Asia, and is consistent with the observations in the Nature paper.